Scroll to:
Study of gas hazard pattern in underground workings after blasting
https://doi.org/10.17073/2500-0632-2022-08-86
Abstract
Determining the sources of hazardous and toxic substances released into mine air, their gas composition, as well as providing each such source of pollution with the required amount of fresh air are important issues in terms of ensuring normal healthy and safe working conditions for miners. This paper studies blasting as one of the most dangerous sources of mine air pollution. The study was carried out for a long dead-end exploration working, and a development (preparatory) working of a copper-nickel mine. In accordance with the federal rules and regulations (FNiP), a number of requirements, including monitoring of gas hazard at a face, is applied to blasting operations.
The study examined the behavior of gas-air mixture in dead-end mine workings after blasting. The findings are based on the experimental data obtained in the conditions of two dead-end workings at an operating coppernickel mine. A technique for the experimental studies of gas release after blasting in a dead-end working was developed. The main technical characteristics of the instruments involved in the in-situ measurements are given. Time dependences of the concentrations of toxic gases after blasting at the blasted working mouth, at the return ventilation current, and near a booster were established. In order to assess the reliability of the data obtained, the volume of released carbon oxides was calculated based on the data of gas analyzers and chemical reactions of explosives decomposition during detonation, depending on the types and weights of the explosives. A model of gas-air mixture transfer was described, constructed, and calibrated allowing for longitudinal dispersion. The Voronin model was used to simulate the gradual removal of toxic gases from the working face and solving the problem of boundary conditions. Based on experimental data, the coefficients of longitudinal dispersion, ventilation efficiency, and volume concentration of the considered gas admixture in the mixing zone at initial time were determined for a long dead-end mine working.
The constructed gas-dynamic model and longitudinal dispersion coefficients obtained as a result of the analysis enabled the time required for long dead-end mine workings ventilation to be analysed and estimated. Based on the model, the algorithm for calculating the velocity of spreading the combustion products in a mine ventilation network in emergency situations is being improved. The value of longitudinal dispersion coefficient for different operating conditions is also being refined.
Based on the gas distribution simulation within the interval of 1,500 m from a working face, the time required for the ventilation of a dead-end mine working was determined.
Keywords
For citations:
Olkhovskiy D.V., Parshakov O.S., Bublik S.A. Study of gas hazard pattern in underground workings after blasting. Mining Science and Technology (Russia). 2023;8(1):47-58. https://doi.org/10.17073/2500-0632-2022-08-86
Study of gas hazard pattern in underground workings after blasting
Introduction
Determining the sources of hazardous and toxic substances released into mine air, their gas composition, as well as providing each such source of pollution with the required amount of fresh air are the important issues in terms of ensuring normal healthy and safe working conditions for miners [1]. Mine air gas composition depends on a number of factors (man-made and natural sources of pollution) [2]:
- rock breaking method;
- blasting;
- applying mining machinery and equipment;
- rock gas content;
- rock gas-dynamic characteristics.
This paper studies blasting as one of the most dangerous sources of mine air pollution. The study was carried out for the case of a long dead-end exploration mine and a development (preparatory) working of a copper-nickel mine. In accordance with the federal rules and regulations (FNiP), a number of requirements, including monitoring of gas hazard at a face, is applied to blasting operations1.
The study objectives included:
- in-situ measuring the mine air gas composition at different distances from a working face over time;
- simulation of gas-dynamic processes in a long dead-end mine working after blasting;
- determination of the coefficients of longitudinal dispersion and ventilation efficiency;
- determination of changing the required time of a long dead-end working ventilation as its driving proceeds on the basis of the simulation results.
Based on experimental data, the coefficients of longitudinal dispersion, ventilation efficiency, and volume concentration of the considered hazardous gas in the mixing zone at initial time were determined for a long dead-end working. As a result, the rate of decreasing toxic gases concentrations was determined, taking into account the actual parameters of a working ventilation, the flow rate of air supplied to the face, and the time of its ventilation. Based on the measurements, the amount of gases released after blasting was determined. The results of theoretical studies allowed the performance of a working ventilation to be assessed, taking into account the prospective development of mining, on the basis of the developed and verified gas-dynamic model of a working.
1 Federal norms and rules in the field of industrial safety “Safety rules for the production, storage and use of explosive materials for industrial use”: approved by order of the Federal Service for Environmental, Technological and Nuclear Supervision dated December 03, 2020 No. 494.
Experimental studies in a development (preparatory) working
The general pattern of the measurements was as follows: prior to blasting in dead-end workings at predetermined points, portable gas analyzers were installed in the mode of recording readings, and the ventilation air flow rates were measured prior to and after blasting. In most workings the measurement points were located as follows (Fig. 1):
- point 1 – at a booster fan;
- point 2 – at the mouth of a working;
- point 3 – at the return ventilation current from a dead end.
The location of a gas analyzer at point 1 enabled the presence of toxic gases and the degree of influence of the toxic gases recirculation on the face ventilation to be assessed. The gas analyzer at point 2 enabled the time required to ventilate a dead-end working, as well as the volume of the released gases to be determined. The gas analyzer at point 3 enabled the time of removal of the toxic gases and the degree of dilution of the toxic gases by return ventilation current to be assessed, taking into account the additional fresh air intake.
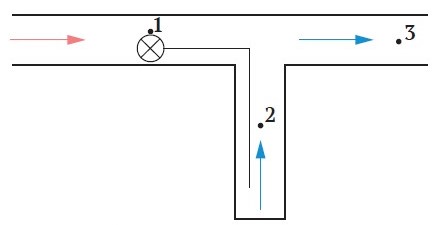
Fig. 1. Locations of portable gas analyzers
According to this pattern, the measurements were carried out in a development (preparatory) working (Stope drift 26-20-1). Dräger X-am 5600 portable gas analyzers were used for the measurements (their technical specifications are presented in Table 1).
The volume of air was determined by an APR-2 propeller-type anemometer and a Leica Disto X310 laser rangefinder. The main technical characteristics of the devices are given in Table 2.
Table 1
Technical specifications of a Dräger X-am 5600 gas analyzer
| Measured gas | Measuring range | Sensor lower detection limit | Measurement error | Sensor response time |
| Methane CH4 | 0–100 % LEL | 0.1 % LEL | ± 5 % LFL | Up to 15 s |
| Carbon dioxide СО2 | 0–5 vol. % | 0.01 vol. % | ± 10 % | Up to 15 s |
| Oxygen О2 | 0–25 vol. % | 0.1 vol. % | ± 5 % | 5–90 s |
| Carbon monoxide СО | 0–2000 ppm | 1 ppm | ± 15 % | 5–90 s |
| Nitric oxide NO | 0–200 ppm | 0.1 ppm | ± 10 % | 5–90 s |
| Nitrogen dioxide NO2 | 0–50 ppm | 0.1 ppm | ± 15 % | 5–90 s |
Table 2
Technical specifications of the anemometer and rangefinder
| Measured value | Measuring range | Measurement error |
| APR-2 | ||
| Airflow velocity | 0.2-40 m/s | ± (0.1 + 0.05·V) m/s |
| Leica Disto X310 | ||
| Length | 0.05-120 m | ± 1.0 mm |
The blasting of any industrial explosive produces toxic gases in varying quantities [3]. The main products of industrial explosives blasting are: carbon oxides CO and CO2, sulfur dioxide SO2, and nitrogen oxides NO, NO2 [4]. The concentration of sulfur dioxide SO2 was not measured in this study, due to the strong influence on the readings of the nitrogen dioxide (NO2) gas analyzer sensors.
Processing of the portable gas analyzers data for each measuring point enabled graphs presenting the toxic gas concentrations in a working mine to be constructed as a function of time elapsed. Figs. 2–4 show graphs of carbon monoxide CO and nitrogen dioxide NO2 concentrations as functions of time.
Fig. 5 presents the carbon dioxide CO2 concentrations as functions of time. No significant changes in the concentrations of oxygen O2 and methane CH4 were recorded (were not shown in the graphs).
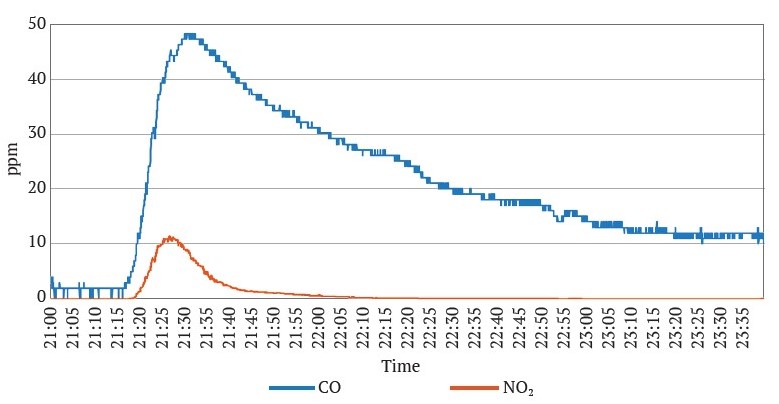
Fig. 2. Toxic gas concentrations at the booster fan (point 1) as functions of time
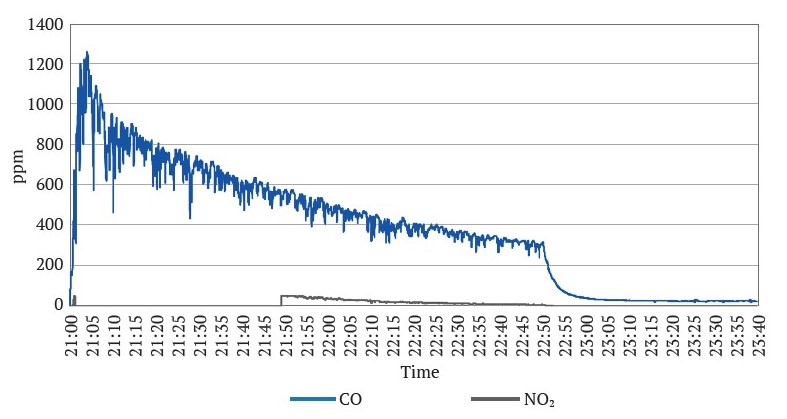
Fig. 3. Toxic gas concentrations at the blasted working mouth (point 2) as functions of time
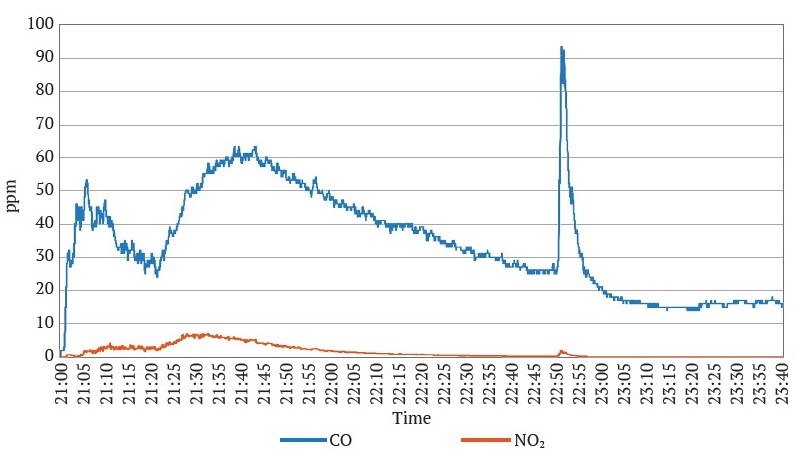
Fig. 4. Toxic gas concentrations at the return ventilation current (point 3) as functions of time
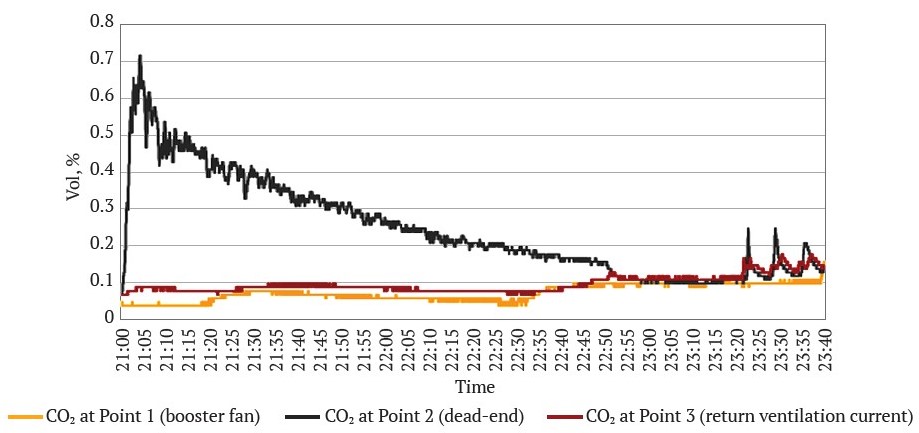
Fig. 5. Carbon dioxide concentrations at the booster fan (point 1), at the blasted working mouth (point 2), at the return ventilation current (point 3) as functions of time
The time of working ventilation required to achieve a concentration decrease below the Maximum Permissible Concentration (MPC) was 130 minutes–much longer than the time permitted by the federal rules and regulations (FNiP) (30 minutes)2. The results of the monitoring of the toxic gases concentrations after blasting suggest that the booster fan was turned off prior to blasting and was launched only at 22:50. This means that the working was not ventilated by active air current for 110 minutes. This assumption is supported by the curve in Fig. 3, where the concentration of toxic gases begins to sharply decrease after switching on the booster fan. In the return ventilation current (see Fig. 4), the concentration of the toxic gases, on the contrary, sharply increased. This suggested the rapid removal of the toxic gases from the dead-end working and evidenced the activation of the booster fan. In 20 minutes after booster fan activation, the concentration of the toxic gases reached the background values. This indicated a sufficient level of ventilation under the condition of a permanently operating booster fan.
In addition, the experimental data analysis allows certain conclusions to be drawn. In Figs. 2 and 4, an increase in the concentrations (in ≈ 21:30) is seen, indicating the arrival of toxic gases after blasting from other workings. This is the result of the sequential ventilation of working zones causing increased gas hazard in some workings of a mine due to nonoptimum ventilation. The carbon dioxide concentration peaks in Fig. 5 after 23:20 are presumably caused by starting operation of ICE equipment in the workings.
The concentration of nitrogen dioxide at the blasted working mouth exceeded the effective measuring range of the portable gas analyzer (50 ppm). In order to assess the reliability of the data obtained, the calculation of the volume of the carbon oxides released was performed based on the data of gas analyzers and the chemical reactions of the explosives’ decomposition during detonation, depending on the types and weights of the explosives.
The volumes of the released carbon oxide CO and dioxide CO2, m3 were calculated from the data of gas analyzers by determining the average concentrations from the moment of starting the increase in the concentration to the moment of the decrease to the background values:
Vco = (φav + φback)Qt, (1)
(for the case of CO), where φav is average gas concentration from the moment of starting the increase in the concentration to the moment of the decrease to the background values, m3/m3; φback is background gas concentration, m3/m3; Q is air flow rate in the point, m3/s; t is time from the moment of starting the increase in the concentration to the moment of the decrease to the background values, s.
The results of the calculations of the released volume of carbon monoxide and carbon dioxide (hereinafter referred to as carbon oxides) are presented in Table 3.
Table 3
Results of calculations of the released volume of carbon oxides after blasting in the development (preparatory) working
| Point No. | Air flow rate, m3/s | Volume of released CO, m3 | Volume of released СО2, m3 |
| 2 | 23.2 | – | – |
| 3 | 35.4 | 4.78 | 19.65 |
At point 2, it was impossible to reliably determine the volume of the carbon oxides due to the fact that the booster fan was switched off.
In addition, the volume of releasing other toxic gases depending on the types and weights of explosives used has been estimated.
A mixture consisting of Granulit AS-7 and Ammonit 6 ZhV explosives was used for blasting in the working. The weight of Granulit AS-7 was 280 kg, and that of Ammonit 6 ZhV, 68 kg. The oxygen balance of both explosives is positive.
Granulit AS-7 consists of ammonium nitrate (~90 %), aluminum powder (~7 %), and mineral oil (~3 %). When ammonium nitrate detonates, nitrogen N2, water H2O, and oxygen O2 are released, and the oxygen balance is positive. In addition to the components listed above, nitrogen oxides are also generated during the detonation. Nitrogen oxides (nitrogen oxide NO and nitrogen dioxide NO2) are released due to the incomplete reduction of ammonium nitrate NO3, and also originate at high temperatures. The formula for the decomposition of ammonium nitrate at detonation is as follows [5]:
2NH4NO3 → 2N2 + O2 + 4H2O.
Aluminum powder and oil are added to ammonium nitrate, in order to increase the detonation energy and compensate for the excess oxidizer. Aluminum powders do not release toxic gases during detonation.
In order to calculate carbon dioxide release, the chemical formula of mineral oil is taken as С12Н26 according to [5]. Then the chemical reaction of oil combustion will appear as follows:
2C12H26 + 37O2 → 24C02 + 26H2.
The oil combustion produces carbon dioxide СО2 and, in the case of the shortage of oxygen, carbon monoxide CO. In addition, the oil often contains sulfur, combustion of which produces sulfur dioxide SO2. Estimating its quantity is problematic.
Ammonit 6 ZhV consists of ammonium nitrate (~79 %) and TNT (trinitrotoluene), ~21 %). The detonation of TNT produces nitrogen N2, water H2O, carbon monoxide CO and carbon C.
The formula for the trinitrotoluene decomposition during detonation is as follows [5]:
2C2H5N3O6 → 3N2 + 5H2O + 7CO + 7C.
Trinitrotoluene has a negative oxygen balance, compensated by the positive balance of ammonium nitrate. Thus, the main source of carbon monoxide CO is trinitrotoluene in Ammonit 6 ZhV and oil contained in Granulit AS-7.
With the known weight of an explosive, the maximum volume of the released carbon oxides (COx) m3, is estimated by the following formula:
Vco = (mexplk)/MTNT · molCVmol, (2)
where mexpl is the weight of an explosive, g; k is the weight fraction of the carbon-containing component in the explosive; MTNT is molar mass of the carbon containing component (TNT), g/mol; molC is the number of moles of carbon (including those contained in CO and СО2) released during detonation; Vmol is the volume of one mole of gas, 0.0224 m3.
As a result, the detonation of 68 kg of Ammonit 6 ZhV can release 9.86 m3 of carbon oxides COx. When detonating 280 kg of Granulit AS-7 and the mineral oil contained in it, the maximum possible volume of the released carbon oxides amounts to 13.24 m3. Thus, during blasting of a mixture of 280 kg of Granulit AS-7 and 68 kg of Ammonit 6 ZV, 23.1 m3 of carbon oxides can be released, corresponding to the total volume of carbon oxides measured by the portable gas analyzers at point 3 (24.44 m3). This suggests the credibility of the experimental data measured by the portable gas analyzers.
2 Federal rules and regulations in the field of industrial safety “Safety rules for mining and processing of minerals”: approved by Order No. 505 of the Federal Service for Ecological, Technological and Nuclear Supervision dated 08.12.2020, 524 p.
Experimental studies in a long dead-end working
RV-1, a long exploration working (more than 800 m long at the time of measurements, with a mouth close to the ventilation shaft; fresh air was supplied to the working directly from the surface through a ventilation pipeline) required corrections in the measurement techniques. In order to conduct the field (in-situ) studies after blasting, the sensors (gas analyzers) were installed along the length of a long dead-end working at three points. Point 1 was as close to the blasted face as possible, point 2 was in the middle of the working, and point 3 was located at the working’s mouth. The layout of the sensors is shown in Fig. 6.

Fig. 6. Layout of measuring points in RV-1 working
The layout of measuring points along the working length is due to significant air leaks (about 50 %) along the length of the ventilation duct, laid along the working. In this case, the degree of dilution of toxic gases along the length of the long working and the influence of the longitudinal dispersion of gas impurities are of interest. In this context, the installation of the sensors at the booster fan and in the main return ventilation current is not important due to the lack of possible recirculation of air and the delivery of all the return air through the ventilation shaft directly to the surface.
Fig. 7 shows the experimentally determined time dependences of the toxic gas concentrations in the mouth of the working. The mouth of the working is characterized by the lowest gas concentrations due to their maximum dilution.
The nitrogen dioxide concentrations above 50 ppm were obtained by approximation.
It should be noted that nitrogen dioxide NO2 concentrations at other points exceeded the measuring ranges of the instruments, so for other measurement points, the data is given only for carbon monoxide CO and carbon dioxide CO2. The plots of the concentrations of carbon monoxide CO at points 1, 2, and 3 and carbon dioxide CO2 at points 1 and 3 as functions of time are shown in Figs. 8 and 9, respectively.
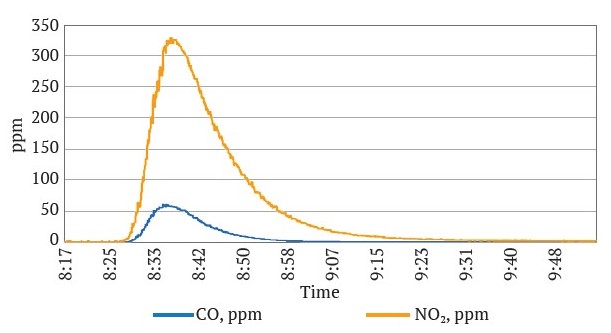
Fig. 7. Time dependences of the concentrations of toxic gases after blasting in point 3
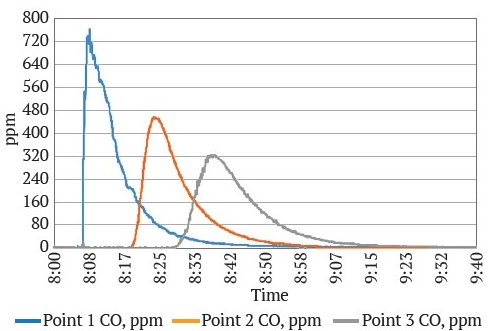
Fig. 8. Time dependences of carbon monoxide CO concentrations in the working after blasting
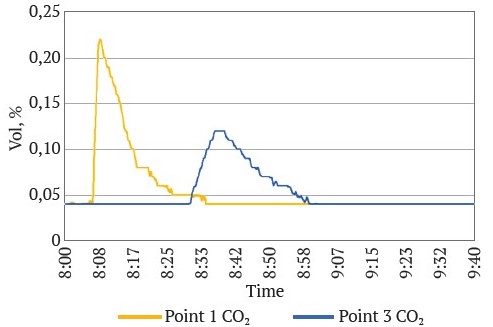
Fig. 9. Time dependences of carbon dioxide CO2 concentrations in the working after blasting
According to the data obtained, the concentration of toxic gases decreases as the air flows along the working, while the time of exceeding the maximum permissible concentration increases. This is due to the leaks in the ventilation duct and longitudinal dispersion [6, 7] which do not allow simplified models [8] to be applied.
In Table 4, the data on the distance of the points from the working face, the time of exceeding MPC at them, the air flow rate, and the volume of carbon monoxide CO passing through them are presented.
Table 4
Results of the study of the gas hazard in the working after blasting
| Measuring point number | Distance from the face to the measuring point, m | Start time of exceeding MPC (17 ppm) | End time of exceeding MPC (17 ppm) | Required duration of ventilation | Air flow rate at the measuring point, m3/s | Volume of released CO, m3 | Volume of released СО2, m3 |
| RV-1 working | |||||||
| 1 | 40 | 8:06 | 8:38 | 63 min | 10 | 4.0 | 9.1 |
| 2 | 410 | 8:20 | 8:53 | – | – | – | |
| 3 | 810 | 8:32 | 9:09 | 15.5 | 4.8 | 10.6 | |
In order to assess the reliability of the obtained results of the toxic gases concentrations monitoring in the mine working after blasting, the volume of the released toxic gases depending on the types and weights of the explosives used was assessed.
For blasting purposes, a mixture consisting of Granulit AS-7 and Ammonit 6 ZhV explosives was used in the working. The weight of Granulit AS-7 was 200 kg, and the weight of Ammonit 6 ZhV was 34 kg. As a result, the detonation of 34 kg of Ammonit 6 ZhV can release 4.92 m3 of carbon oxides COx. When detonating 200 kg of Granulit AS-7 and the mineral oil contained in it (6 kg), the maximum possible volume of the released carbon oxides amounts to 9.46 m3. Thus, blasting of a mixture of 200 kg of Granulit AS-7 and 36 kg of Ammonit 6 ZV can release 14.38 m3 of carbon oxides which corresponds to the total volume of carbon oxides measured by the portable gas analyzers at Points 1 (13.1 m3) and 3 (15.4 m3). This suggests the reliability of the experimental data obtained with due consideration of the instrument accuracy and the sensor response delay in the gas concentration measurements. The resulting volume of the released carbon oxides was used for the mathematical simulation of the gas distribution in the ventilation network of the mine workings after blasting.
The ventilation time required in the long working, in order to achieve the concentration decrease below the Maximum Permissible Concentration (MPC) was 63 minutes – much longer than the time permitted by the federal rules and regulations (FNiP) (30 minutes)3.
3 Federal rules and regulations in the field of industrial safety “Safety rules for mining and processing of minerals”: approved by Order No. 505 of the Federal Service for Ecological, Technological and Nuclear Supervision dated 08.12.2020, 524 p.
Theoretical Studies
In order to analyze the temporal dynamics of toxic gas impurities blow-away from the RV-1 working face depending on the distance of the face from the mouth, a non-stationary gas-dynamic model was developed.
The following assumptions were taken in the model:
- the volumetric concentrations of gases are small, so the difference in the density of the gas-air mixture they create in different parts of the dead-end working cannot result in a significant gas depression and/or convective stratification of the flows along a working cross-section;
- the concentration of toxic gases is uniform in the cross-section of a mine workings;
- all physical processes are determined only by time and the longitudinal coordinate of aworking.
This assumption allows considering workings geometrically as one-dimensional objects;
- the Ox coordinate system is selected in such a way that the longitudinal x-axis is directed in the direction of air flow in adead-end working, and the origin of coordinates O is in the face of aworking;
- the zone of irregular vortex air motion near the face is negligibly small compared to the total length of aworking;
- the model takes into account the process of mixing harmful gas impurities with fresh air by setting the contact boundary of the vortex mixing zone with the zone of unidirectional and steady air movement in the model.
Analyzing the time dependences of CO concentrations in the working (see Fig. 10), one can observe the concentration dispersion with increasing distance from the face. This indicates that gas dispersion takes place in the workings. According to [8], dispersion includes both “dissipation” of admixtures due to the airflow velocity non-uniformity across the cross-section, and longitudinal turbulent diffusion due to еруturbulent pulsations of the flow velocity at each of its points. The molecular diffusion of a dust and air mixture is generally considered negligible when considering the turbulent air flows in mine workings. It correlates with turbulent diffusion in the same way as molecular viscosity with turbulent, i.e. it is lower than the latter by one-three orders of magnitude [9, 10]. The main factor that leads to the dispersion of admixtures at the straight runs of the working is the nonuniform cross-sectional airflow velocity. It is important to note that the effect of airflow dispersion, caused by the turbulent diffusion and nonuniformity of the velocity field across the cross-section, is true primarily for the one-dimensional models of mine workings within the ventilation network.
The convection-diffusion transfer equation was solved to describe a gas admixture transfer in mine workings [11]:

where c = c(t, x) is volume concentration of the considered gas impurity, m3/m3; v = v(x) is airflow velocity in a working, m/s; D is longitudinal dispersion coefficient, m2/s [12, 13]; x is longitudinal coordinate, m; t is time, s. Taking into account the dependence of airflow velocity v on the longitudinal coordinate enables the air leaks in the ventilation duct to be explicitly calculated.
The contact boundary with the mixing zone and the mouth of the working are taken as the boundaries of the calculation area. The following boundary conditions are set on these boundaries:
с(t, xmixing) = cmixing, (4)

where xmixing is contact boundary with the mixing zone, m; xmouth is boundary of the working mouth, m; cmixing = cmixing(t) is volume concentration of gas in the mixing zone, m3/m3.
The position of the contact boundary with the mixing zone is determined by the following formula [14]:
xmouth = xp + 4deff, (6)
where xp is distance from the face to the end of the ventilation duct, m; deff is equivalent diameter of the working, m.
The equivalent diameter is calculated using the following formula:
deff = 4S/P, (7)
where S is cross-sectional area of the working, m2; P is the working perimeter, m.
The Voronin model [15] is used to determine the volume concentration in the mixing zone cmixing:
cmixing = c0 exp (-kQрt/Vmixing), (8)
where c0 is volume concentration of the considered gas impurity in the mixing zone at the initial time, m3/m3; k is ventilation efficiency coefficient; Qp is rate of airflow leaving the duct, m3/m3; Vmixing = xmouth, S is mixing zone volume, m3.
At the initial time, in the calculation area, zero concentration of a harmful gas impurity is set:
c(0, x) = 0. (9)
As a result, equations (2)–(8) constitute a mathematical gas-dynamic model of harmful gas admixtures removal from a working during ventilation after gas release at a face. It is worth noting that the values of D, c0 and k for each working and gas must be determined by backward analysis [16], using the results of field (experimental) measurements, like those obtained for CO in Fig. 7.
The numerical solution of the problem of convection-diffusion transfer of a gas admixture in workings was sought using finite-difference method by means of splitting by physical processes, convection and diffusion [17] (if necessary, taking into account the action of a mass source of a harmful admixture).
It should be noted that the calculation of gas concentrations and calibration of the model were performed based on the carbon monoxide CO concentrations measured during the experimental studies at the time of blasting in three points along the length of mine workings (see Fig. 10). Of all three measuring points, the measuring results at point 3 are considered to be the most reliable. This is justified by the fact that due to the longitudinal dispersion, the entire gas volume passes through point 3 without sharp changes in the concentrations. In this case, the sensitive element of a sensor (gas analyzer) has time to measure the concentration of gas passing through it more accurately, i.e. the influence of the sensor time response decreases.
However, in order to determine the concentration in the mixing zone at the initial time c0 the results of the measurements at point 1 are required, because this point is within the mixing zone, therefore, the maximum CO concentration at point 1 will determine the value of c0.
The ventilation efficiency coefficient k and the longitudinal dispersion coefficient D are determined by backward analysis using the results of the measurements at point 3 [18]. The backward analysis consists in the following:
- Knowing the value of c0, the value of k is selected so that the gas mass balance between point 3 and the boundary of the mixing zone is maintained.
- Having fully determined the parameters of the boundary condition on the boundary of the mixing zone, simulation is carried out with different values of the longitudinal dispersion coefficient D. Finally the D value is found by the selection, at which the simulated dispersion of gas (decreasing its concentration) over time in point 3 coincides with the experimental measurement data.
The obtained values of parameters c0, k, and D for the RV-1 are given in Table 5.
Table 5
Value of longitudinal dispersion coefficient and parameters in Voronin mixing model
| D, m2/s | c0 | k |
| RV-1 working | ||
| 2.5 | 765 | 0.11 |
The results of the simulation of gas distribution in the working at point 3 are shown in Fig. 10. In addition, the Figure shows the results of the experimental measurements, the time dependence of the gas concentration.
Comparative analysis of the results of the simulation and measurements (Fig. 10) showed that the developed gas distribution model, when calibrated by the field (in-situ) measurements, enabled an acceptable agreement to be obtained with the time dependence of the measured gas concentrations at point 3. The existing differences between the simulated and measured dependences can be explained by a number of reasons: due to the rapid transfer of CO through the sensor at point 1 and the sensor time lag (see Table 1), it is impossible to correctly determine the time dependence of the gas concentration that leads to a slight shift of the experimental dependence to the right and less accurate estimate of c0; value; the lack of accurate data on the distribution of air leaks along workings; use of a constant coefficient of longitudinal dispersion; applying a simplified model of air mixing at a face. It is important to note that, through selecting the effective simulated airflow rate in a working, it is possible to achieve almost perfect coincidence of the theoretical curve and the measurement point data.
Based on the values of carbon monoxide CO concentrations obtained in the model, it was found that the MPC level at the mouth of the working is achieved in 18 minutes after blasting. Then, the concentration of CO at the mouth decreases to the MPC only after 52 minutes of the working ventilation after blasting.
In addition, after the calibration and verification of the model, the simulation of the working ventilation was carried out for the case of increasing its length up to 1,500 m. It was assumed that the airflow rate in the working from the mouth to the previous position of the face corresponds to the previous initial parameters, and the minimum airflow rate of 9 m3/s was accepted for the newly driven part of the working. The simulation results are shown in Fig. 11.
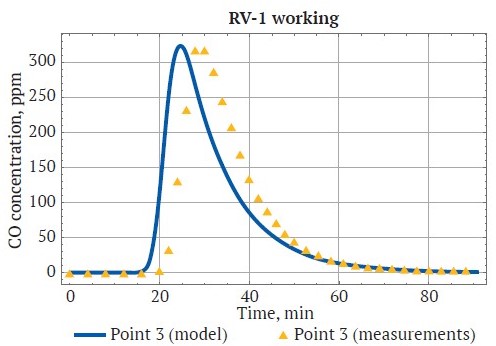
Fig. 10. Comparative analysis of the time dependences of CO concentration at measuring point 3 in the working
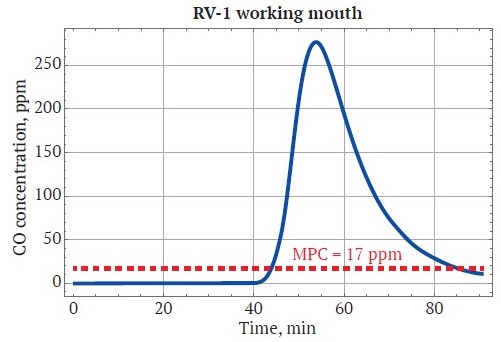
Fig. 11. Time dependence of CO concentration at the working mouth at 1500-m distance between the face and the mouth
When increasing the working length up to 1,500 m, it was established that the time after blasting for the concentration of CO to reach MPC at the mouth increased to 87 min (38 % more than for the shorter working length).
The constructed gas-dynamic model and the longitudinal dispersion coefficients obtained as a result of the analysis enable the time required for long dead-end mine workings ventilation to be analyzed and estimated. Based on the model developed, the algorithm for calculating [8] the velocity of spreading the combustion products in the mine ventilation network in emergency situations is being improved, and the longitudinal dispersion coefficient for different operating conditions is being refined.
Conclusions
The experimental (measurement) data obtained from the study of blasting operations in RSH-26-20-1 and RV-1 mine workings enabled the actual time of ventilation of a dead-end working and the amount of carbon monoxide СОx released to be determined. The results obtained were analyzed for the correspondence to the total amount of gas released after blasting, depending on the types and weights of the explosives used.
Based on the obtained graphs of the time dependences of the concentrations of toxic gases along the length of RV-1 working, a mathematical model of the dynamics of a gas-air mixture was built and calibrated, taking into account the convection-diffusion transfer. Based on the experimental data, the coefficients of longitudinal dispersion, ventilation efficiency, and the volume concentration of the considered gas admixture in the mixing zone at initial time were determined for a long dead-end mine working (RV-1). The time required for the ventilation of long dead-end workings since its driving proceeds was determined on the basis of the simulation results.
References
1. Grishin E. L. Gas behavior in the modern concept of mine ventilation. Gornoe Ekho. 2021;(4):101–104. https://doi.org/10.7242/echo.2021.4.20
2. Ushakov K. Z., Burchakov A. S., Puchkov L. A., Medvedev I. I. Aerology of mining enterprises. Moscow: Nedra Publ.; 1987. 420 p. (In Russ.)
3. Dubnov L.V., Bakharevich N. S., Romanov A. I. Industrial explosives. 3 rd ed. Мoscow: Nedra Publ.; 1988. 358 p. (In Russ.)
4. Ganapolsky M. I., Baron V.L., Belin V.A., et al. Methods of blasting operations. Special blasting operations. Textbook. Мoscow: Moscow State Mining University Publ.; 2007. 563 p. (In Russ.)
5. Gushin V.I. Set of problems on blasting. Мoscow: Nedra Publ.; 1990. 174 p. (In Russ.)
6. Semin M. A., Isaevich A. G., Trushkova N. A. et al. Calculating dispersion of air pollutants in mines. Fiziko-Texhnicheskiye Problemy Razrabbotki Poleznykh Iskopaemykh. 2022;(2):82–93. (In Russ.) https://doi.org/10.15372/FTPRPI20220208
7. Widiatmojo A., Sasaki K., Widodo N. P., Sugai Y. Numerical simulation to evaluate gas diffusion of turbulent flow in mine ventilation system. International Journal of Mining Science and Technology. 2013;23(3):349–355. https://doi.org/10.1016/j.ijmst.2013.05.004
8. Levin L. Yu., Kormshchikov D.S., Semin M. A. Rapid determination of combustion gas distribution in mine workings. Mining Informational and Analytical Bulletin. 2013;(12):179–184. (In Russ.) URL: https://giabonline.ru/files/Data/2013/12/179-184_Levin_-_6_str.pdf
9. Vengerov I. R. Thermophysics of underground mines and open pits. Mathematical models. Vol. 1. Paradigm analysis. Donetsk: Nord-Press Publ.; 2008. 632 p.
10. Vardy A. E., Brown J. M. B. Transient turbulent friction in smooth pipe flows. Journal of Sound and Vibration. 2003;259(5):1011–1036. https://doi.org/10.1006/jsvi.2002.5160
11. Zhou A., Wang K. A transient model for airflow stabilization induced by gas accumulations in a mine ventilation network. Journal of Loss Prevention in the Process Industries. 2017;47:104–109. https://doi.org/10.1016/j.jlp.2017.02.014
12. Arpa G., Widiatmojo A., Widodo N. P., Sasaki K. Tracer gas measurement and simulation of turbulent diffusion in mine ventilation airways. Journal of Coal Science and Engineering (China). 2008;14(4):523–529. https://doi.org/10.1007/s12404-008-0401-x
13. Kim D.Y., Lee S. H., Jeong K. H., Lee C. W. Study on the turbulent diffusion coefficients of contaminants in an underground limestone mine with large cross section using tracer gas. Geosystem Engineering. 2013;16(2):183–189. https://doi.org/10.1080/12269328.2013.806051
14. Kolesov E.V., Kazakov B. P. Efficiency of ventilation of dead-end development headings after blasting operations. Bulletin of the Tomsk Polytechnic University. Geo Assets Engineering. 2020;(7):15–23. (In Russ.) https://doi.org/10.18799/24131830/2020/7/2715
15. Voronin V.N. Fundamentals of Mine Aerogasdynamics. Moscow-Leninrgad: Ugletekhizdat Publ.; 1951. 491 p. (In Russ.)
16. Isaevich A., Semin M., Levin L. et al. Study on the dust content in dead-end drifts in the potash mines for various ventilation modes. Sustainability. 2022;14(5):3030. https://doi.org/10.3390/su14053030
17. Voevodin A. F., Goncharova O.H. Method of splitting into physical processes for numerical investigation of convection proble. Matematicheskoe Modelirovanie. 2001;13(5):90–96. (In Russ.) URL: https://www.mathnet.ru/php/archive.phtml?wshow=paper&jrnid=mm&paperid=717&option_lang=rus
18. Nakaryakov E.V., Semin M. A., Grishin E. L., Kolesov E.V. Analysis of the regularities of accumulation and removal of the exhaust gases from the combustion-engined vehicles in the dead-end chamber-like mine workings. Occupational Safety in Industry. 2021;(5):41–47. (In Russ.) https://doi.org/10.24000/0409-29612021-5-41-47
About the Authors
D. V. OlkhovskiyRussian Federation
Dmitriy V. Olkhovskiy – Engineer, Mining Production Development Laboratory.
Perm, Scopus ID 57225125993
O. S. Parshakov
Russian Federation
Oleg S. Parshakov – Cand. Sci. (Eng.), Researcher, Mining Production Development Laboratory.
Perm, Scopus ID 57202379375
S. A. Bublik
Russian Federation
Sergey A. Bublik – Engineer, Laboratory of Mathematical Modeling of Geotechnical Processes.
Perm, Scopus ID 57223084283
Review
For citations:
Olkhovskiy D.V., Parshakov O.S., Bublik S.A. Study of gas hazard pattern in underground workings after blasting. Mining Science and Technology (Russia). 2023;8(1):47-58. https://doi.org/10.17073/2500-0632-2022-08-86
JATS XML


