Scroll to:
Vibration metrics for informational support in assessing the technical condition of ball mills
https://doi.org/10.17073/2500-0632-2023-10-175
Abstract
The technical condition of ball mills, employed in the fine grinding of minerals, ores, coal, cement clinker, and other materials, is dictated by both the operational load and the actual physical state of the equipment. Vibration metrics serve as the most versatile diagnostic parameter for developing an informational profile of equipment in active use. The distinct operational environments of high-powered ball mills with frequency-controlled drive systems – one with an induction motor (FC-IM) and the other with a synchronous motor (FC-SM) – necessitate the development of universal approaches to assessing vibration loading that consider each mill's unique design features and operational modes. This study presents the first analysis of the key interrelated technical characteristics of industrial ball mills, including drum volume, diameter, rotational speed, ball load, total weight, and drive power, enabling a more substantiated approach to selecting technical parameters and operational modes. The installation of a permanent vibration control system on ball mills used for grinding mineral raw materials required the individual determination of technical condition category thresholds for the motor, gear-shaft, and drum. The category thresholds were determined individually for each shaft using statistical classification, under the assumption that coupled components are in a state influenced by the energy potential of damage during staged progression. Standard 'reference' ratios of vibration values across three mutually perpendicular directions were established. Characteristic patterns and sequences of damage progression were identified based on the direct spectra of vibration velocity and acceleration. During the analysis of vibration signal time series, a beat frequency mode was detected, indicating potential damage development within gear elements. Effective informational support for the operational condition of ball mills is achieved through the analysis of overall vibration levels, direct trends in vibration velocity and acceleration, time series of the vibration signal, and both long-term and short-term trend analyses. Vibration velocity trends provide insights into technical condition by assessing operational stability, startup frequency, and maintenance intervals.
Keywords
For citations:
Borisenko V.F., Sidorov V.A., Sushko A.E., Rybakov V.N. Vibration metrics for informational support in assessing the technical condition of ball mills. Mining Science and Technology (Russia). 2024;9(4):420-432. https://doi.org/10.17073/2500-0632-2023-10-175
Vibration metrics for informational support in assessing the technical condition of ball mills
Introduction
The operational condition of ball mills used for preparing minerals, ores, coal, cement clinker, and other materials for fine grinding to sizes ranging from 0.074 to 0.4 mm is determined by the operational load, actual physical state, and the quality of maintenance and repairs. In this context, vibration metrics serve as the most versatile diagnostic indicator for creating an informational profile of equipment in active operation.
Literature Review
Vibration measurements of ball mill components in certain industrial sectors have shown that unique characteristics, large dimensions, low rotational speeds, and other factors limit the application of traditional approaches commonly used in vibration diagnostics. The issues of vibration diagnostics presented in the monograph [1] are undoubtedly classical; however, discrepancies arise in the evaluation of technical condition categories when assessing overall vibration levels. Differences also emerge when analyzing time series of vibration signals, unlike those discussed in [2]. The vibration spectra examples provided in [3] should also be supplemented with results obtained from diagnostics of this equipment. According to the standard1, ball mills are classified as Class III – large machines mounted on rigid foundations without differentiation by drive type. The standard2 specify vibration limits for machinery operating at “nominal speeds between 120 and 15,000 rpm”. Certain general provisions related to vibration measurement and analysis, as outlined in various standards3, served as the foundation for this study, which aims to refine specific aspects of vibration analysis for assessing the condition of ball mills.
The design, calculations, and operational conditions of ball mills have been actively studied over an extended period, spanning both the 20th and 21st centuries. Primary attention has been given to technological aspects [4]; however, the quality of grinding is proposed to be assessed by the vibration of the drum walls [5]. The grinding patterns within ball mills [6] can also be validated by the vibration characteristics of an operating mill [7] based on a simulated model of wall vibration. Issues related to the modernization of horizontal ball mill drives [8] indicate efforts to enhance the durability of this equipment. The operational practice of ball mills necessitates information on the vibration profile based on experimental research [9] and the identification of diagnostic indicators of damage to specific components, such as gear transmissions, using digital twin technology [10]. This brief literature review confirms the relevance of vibration diagnostics for ball mills and the application of resulting data to support technical condition assessment. It also underscores the timeliness of discussing industrial research data that define the vibration profile of ball mills.
1 GOST ISO 10816-1-97. Vibration. Machine condition monitoring based on vibration measurements of non-rotating parts. Part 1. General requirements.
2 GOST R ISO 10816-3-99. Machine condition monitoring based on vibration measurements of non-rotating parts. Part 3. Industrial machines with a nominal power above 15 kW and nominal speeds from 120 to 15,000 rpm.
3 GOST R ISO 13373-1-2009. Condition monitoring and diagnostics of machines. Vibration condition monitoring. Part 1. General methods; GOST R ISO 13373-2-2009. Condition monitoring and diagnostics of machines. Vibration condition monitoring. Part 2. Processing, analysis, and presentation of vibration measurement results.
General provisions
Currently, significant attention is focused on optimizing drive systems, automation, and control in grinding processes4. For the first time, an analysis of the primary interrelated technical characteristics of industrial ball mills (Fig. 1) has been conducted, including parameters such as drum volume – Vb, m3, drum diameter– Db, m, rotational speed – W, rad/s, ball load – Qmel, t, total weight– Q, and drive power – P, kW. By comparing the correlation dependencies Q = f(Vb) and Р = f(Vb), their similarity can be noted; conversely, for the dependencies W = f(Db) and Qmel = f(Vb), an inverse similarity is observed. The established correlation dependencies for the graphs:
Q = f(Vb): y = 0.09x2 + 2.4252x – 7.7403, R² = 0.8516; (1)
Р = f(Vb): y = 0.933x2 + 8.5701x – 34.735, R² = 0.91474; (2)
W = f(Db): y = −13.14 ln x + 124.82, R² = 0.9334; (3)
Qmel = f(Vb): y = 0.0548x2 + 1.6284x – 6.296, R² = 0.9037, (4)
will enable specialists in design and operation to make more informed decisions regarding the selection of technical parameters and operational modes for both existing and planned-for-commissioning ball mills.
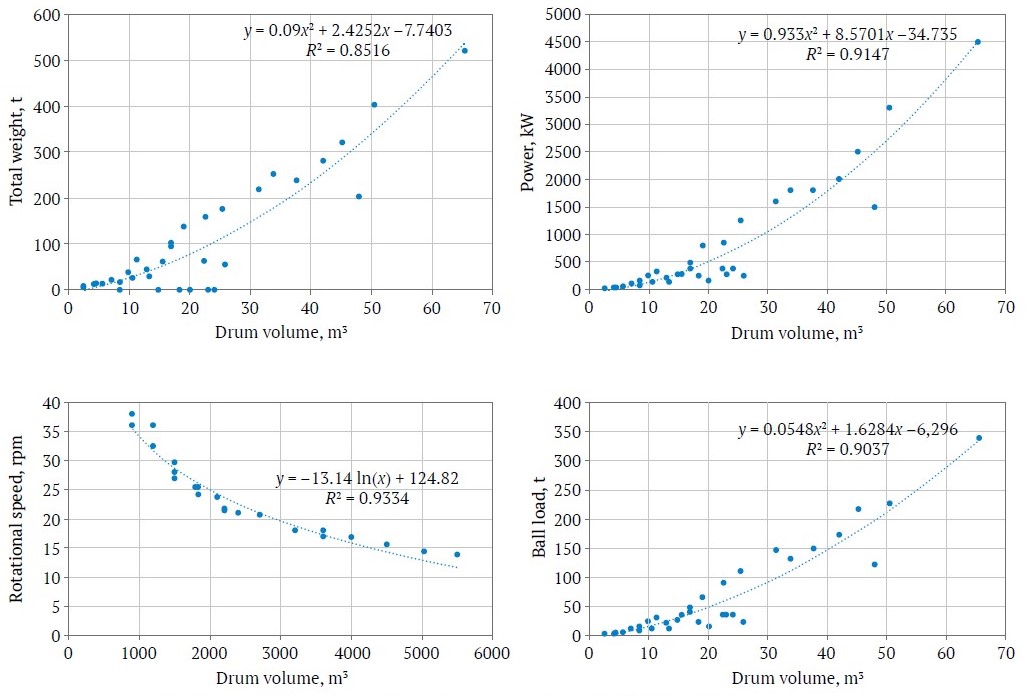
Fig. 1. Correlations between key characteristics of available ball mill size classifications
The wide variability in technical specifications should be factored in when setting vibration standards, as these mills are often manufactured as customized units or in limited production runs for specialized orders. The prolonged operational cycle for crushing and grinding raw materials allows for the use of either synchronous or induction motors as ball mill drives. A synchronous motor with a rotational speed of 75 rpm or 150 rpm, to achieve a drum rotation speed of 13–16 rpm, requires the use of a single-stage gear unit with a gear ratio of 5.4–9.0, with the drum’s ring gear acting as the drive wheel of the gear unit.
The use of an induction motor requires installing either a cylindrical gear unit5[8] (with one or two low-speed gears) or a planetary gear unit6 with a high gear ratio. A direct drive configuration from the low-speed shaft of the gear unit, without using the drum’s ring gear as the drive wheel of the gear unit, is also possible. Implementing a dual-gear unit drive reduces overall system reliability due to the increased number of components or insufficient motor load. In the event of a motor failure, the remaining motor is expected to complete the current stage of the technological process. To ensure continuous grinding operation when using multiple ball mills, partial redundancy is employed, allowing maintenance on one or more machines. Transitioning to a predictive maintenance strategy should be supported by data on individual stiffness characteristics and specific drive type features.
4 Pham Van Bien. Switched reluctance drive for ball mills. Dissertation abstract for the Candidate of Technical Sciences. Institution of defense: South-Russian State Polytechnic University (NPI) named after M.I. Platov, Novocherkassk; 2019; Zakamalden, A. A. Optimal control of the grinding process in a ball mill using a predictive model. Dissertation and Abstract for the Candidate of Technical Sciences. Institution of defense: Tomsk State University of Control Systems and Radioelectronics, Tomsk; 2022; Khanin, S. I. Development of scientific foundations for designing ball mills with energy exchange and classifying devices. Dissertation abstract for the Doctor of Technical Sciences. Institution of defense: Orel State University named after I. S. Turgenev, Belgorod; 2016.
5 FLSmidth company website Gear Units for Horizontal Mills. URL: www.FLSmidthMaagGear.com
6 FLENDER company website. PLANUREX 3 standard series. URL: https://www.flender.com/de/Produkte/Getriebe/PLANUREX-3-Standardbaureihe/p/ATN319
Options for diagnosing the technical condition of mills with synchronous and induction drive motors
The arrangement of vibration measurement control points (Fig. 2) was determined according to the recommendations of the GOST ISO 10816-1–97 standard: 1 – free bearing of the electric motor; 2 – motor bearing near the coupling; 3 – drive gear bearing; 4 – non-drive side bearing of the drive gear; 5 – drum bearing on the drive side; 6 – drum bearing on the non-drive side. The sensor was mounted using a magnetic attachment. The monitored frequency ranges were 2–800 Hz and 10–4000 Hz. Measurements were taken along three mutually perpendicular directions: V – vertical, T – transverse (horizontal), and A – axial.
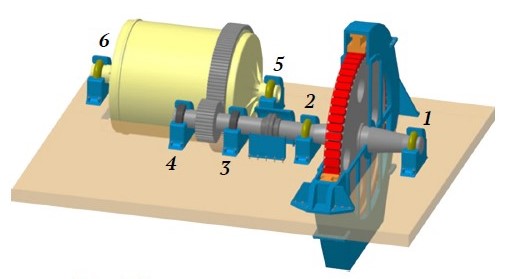
Fig. 2. Arrangement of control points on the ball mill
The ball mill's structure includes three shafts (each mounted on two bearing supports) that are kinematically connected, with variations in rotational speed, bearing support design, and stiffness:
- synchronous drive motor shaft– points 1 and 2;
- drive gear shaft – points 3 and 4;
- mill drum– a hollow shaft with a gear wheel, mounted on sliding bearings– points 5 and 6.
Measurements conducted on coal grinding mills revealed instability in vibration displacement readings within the frequency range of 10–4000 Hz, stable values for vibration velocity, and high values of vibration acceleration in the same frequency range (Table 1). The localization of elevated vibration values at points 3 and 4 suggests misalignment between the gear teeth of the pinion and the wheel, loosening of threaded connections, or damage to the foundation of the drive gear bearing supports.
Table 1
Vibration parameter values for control points of the ball mill
Measurement point | RMS vibration displacement, µm | RMS vibration velocity, mm/s | Vibration acceleration, а-rms/а-peak m/s2 |
1H | 26 / 1 | 0.7 / 0.6 | 0.4/1.6 / 0.4/1.3 |
2H | 36 / 1 | 0.7 / 0.5 | 0.5/2.7 / 0.6/3.2 |
3H | 398 / 60 | 10.6 / 8.3 | 5.4/28.7 / 14/93 |
4H | 470 / 48 | 20.6 / 18.2 | 8.7/19.8 / 9/42 |
5H | 145 / 8 | 2.9 / 1.5 | 1.6/6.3 / 4.2/24 |
6H | 54 / 6 | 2.1 / 1.3 | 1.0/3.4 / 1.5/8.7 |
Note: frequency range: 2–800 Hz / 10–4000 Hz.
The installation of a stationary vibration monitoring system on ball mills for grinding mineral raw materials required the individualized determination of technical condition category thresholds based on overall vibration levels for control points. The diagnostic task sequence required the inclusion of the following provisions.
Study of object characteristics
The mill’s motor shaft connects to the drive pinion shaft through an intermediate shaft equipped with flexible couplings and measuring 3800 mm in length and 450 mm in diameter. This design allows for up to 1º of angular misalignment compensation, equating to 17.6 mm per meter of length. Asymmetrical wear of the flexible coupling elements may occur.
The torque generated by the motor is 533 kN·m. The pinion shaft is a two-support shaft with the drive gear mounted between supports. The supports are double-row spherical roller bearings (type 3680), housed in cups or mounted directly in the casing. The fixed support is positioned on the gear unit side of the re-lining drive.
The gear diameter is 1220 mm, with a linear tooth speed of 4.5 m/s. Lubrication is provided by liquid oil supplied from an oil station. Sealing is non-contact labyrinth type. Nozzles are installed for lubricating the gear wheel, differing from the original design. Technical specifications: high-speed shaft rotation frequency is 75 rpm; the pinion shaft has 46 teeth.
Vibration represents the response of a system with unknown stiffness, damping both the calculated and parasitic forces [11]. The calculated forces in the gear mesh are:
- Tangential Ft = 2Mct/Dp = 2×533/1.156 = 922.1 kN;
- Radial Fr = Ft × tanα/cosβ = 922.1×0.364/0.9945 = 337.5 kN;
- Axial Fа = Ft × tanβ = 922.1×0.105 = 96.8 кН,
where α = 20⁰, tan20⁰ = 0.364; β = 6⁰, cos6⁰ = 0.9945, tan6⁰ = 0.105.
The pinion shaft has a mass of 11,000 kg.
During operation, the pinion shaft is pressed against the bearing support. The wear rate of the pinion shaft teeth is 5.47 times faster than that of the wheel teeth. This differential wear leads to a mismatch in the gear pairing, necessitating adjustment of the pinion shaft’s position while keeping the motor stationary. This wear process is accompanied by increased wear and vibration. Gaps in the gear teeth with varying inclination angles result in the appearance of harmonic and subharmonic components in the gear mesh.
The frequency range includes:
- harmonics of the rotation frequency at 1.25 Hz;
- tooth mesh frequency at 57.5 Hz and its harmonics up to the 5th harmonic at 287.5 Hz;
- subharmonics and 1.5 harmonics are observed in centrifugal ball mill (CBM) 5.5×6.5 at 28.75 Hz (tooth subharmonic), 86.25 Hz (1.5 tooth mesh), 143.75 Hz (2.5 tooth mesh), 201.25 Hz (3.5 tooth mesh):
- bearing frequencies are nearly undetectable, except for frequencies at 8.13, 8.28, 27.81, 28.28, 29.69, 34.22, and 35.16 Hz.
The rotational motion implies that axial vibration has the lowest values, and the ratio between vertical and horizontal components is 0.8.
Vibration velocity values in the axial direction increase in the presence of axial clearances, non-parallel alignment between the gear teeth of the pinion and gear wheel, loosened threaded connections, or a "soft foot". Vibration velocity values in the horizontal direction are the highest, and increased vertical vibration may indicate loosened threaded connections or a "soft foot".
Horizontal vibration velocity values exceed vertical values by 20%. The supports, like the pinion shaft, are symmetric, so:
3V ≈ 4V, 3H ≈ 4H, 3A ≈ 4A.
The thresholds for technical condition categories were determined for each shaft individually through statistical classification, under the assumption that coupled components are in a state defined by the damage energy potential in progressive development stages. Technical condition categories indicate the necessity and urgency of repairs. The 'emergency' category signifies a loss of control over the condition. An example histogram for determining technical condition category thresholds based on overall vibration acceleration (m/s²) is provided in Fig. 3.
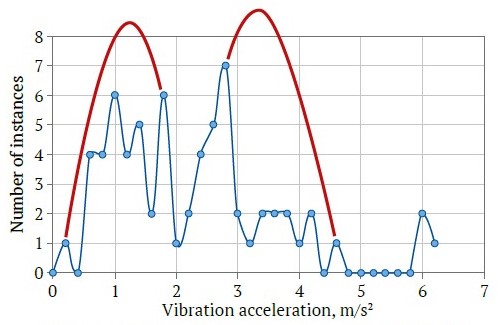
Fig. 3. Histogram of vibration acceleration instances for points 3 and 4 (pinion shaft bearings)
Based on the hypothesis of a minimal number of instances at the thresholds of technical condition categories, as shown in Fig. 3 for the pinion shaft bearings, we established the following condition thresholds: satisfactory – up to 2.0 m/s²; requires correction – 2.0–4.8 m/s²; emergency – above 4.8 m/s².
Similarly, condition category thresholds for overall vibration velocity levels were determined individually for each shaft bearing support.
Technical condition thresholds for the synchronous drive motor bearing supports are as follows: satisfactory – up to 1.8 mm/s; requires maintenance intervention – 1.8–3.0 mm/s; emergency – above 3.0 mm/s.
Technical condition thresholds for the mill drum bearing supports are as follows: good – up to 0.6 mm/s; satisfactory – 0.6–1.5 mm/s; requires maintenance intervention – 1.5–3.0 mm/s; emergency – above 3.0 mm/s.
Technical condition thresholds for the drive pinion shaft bearing supports are as follows: satisfactory – up to 4.5 mm/s; requires maintenance intervention – 4.5–11.2 mm/s; emergency – above 11.2 mm/s. These thresholds align with the recommendations of GOST ISO 10816-1–97.
Based on the analysis of failures and maintenance work, conclusions were drawn regarding:
- the extent of damage and possible actions;
- principles for analyzing overall vibration levels;
- the nature of damage as vibration velocity values increase in specific directions;
- diagnostic guidelines for differentiating damage types based on direct spectra.
Characteristic patterns and the sequence of damage progression were established using the direct spectra of vibration velocity (Fig. 4) and vibration acceleration.
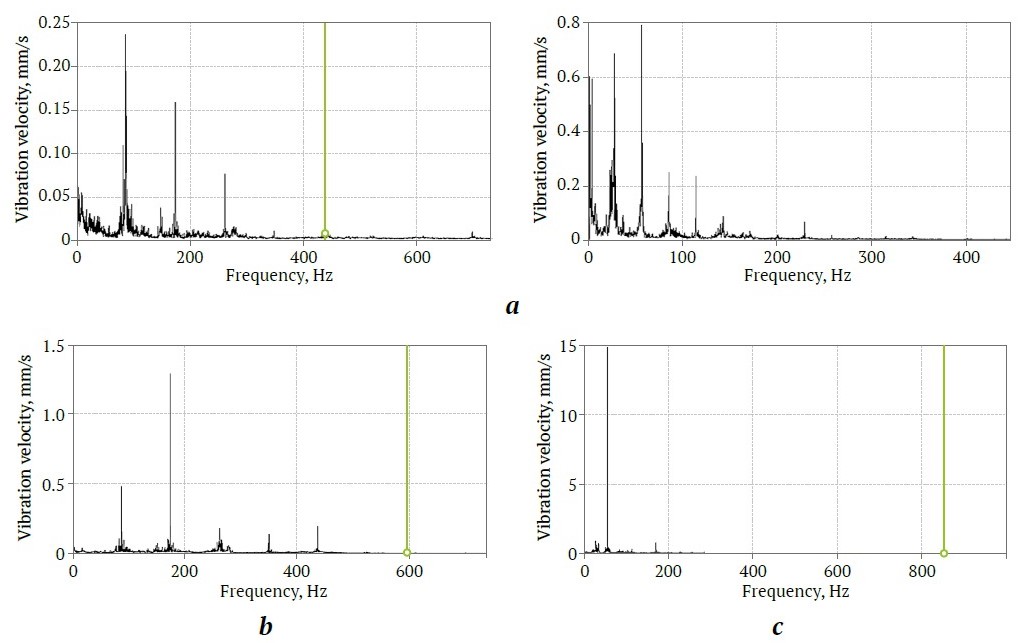
Fig. 4. Damage progression in the direct spectra of vibration velocity at points 3 and 4:
a – good condition – harmonics with low component levels of 0.2–0.8 mm/s; b – satisfactory condition – increase in the amplitude of higher harmonics up to 2.0 mm/s; c – correction required – increase in the amplitude of the first harmonic above 4.5 mm/s, decrease in the amplitude of higher harmonics
The time-domain vibration signal allows for the observation of the emerging beat frequency mode (Fig. 5). For example, in the operation of the gear mechanism of ball mills, beats occur with a period of approximately 1.1 seconds. The beat period is determined by the formula:
Tbeat = 2×π/∆ω (5)
From this, we get:
∆n = 60/Tbeat = 54.5 rpm.
Beats may arise under the following condition:
∆n = nmotor – nmill – 0,5×nmill = 54,5 rpm.
This corresponds to the development of clearances in the sectors of the gear mesh.
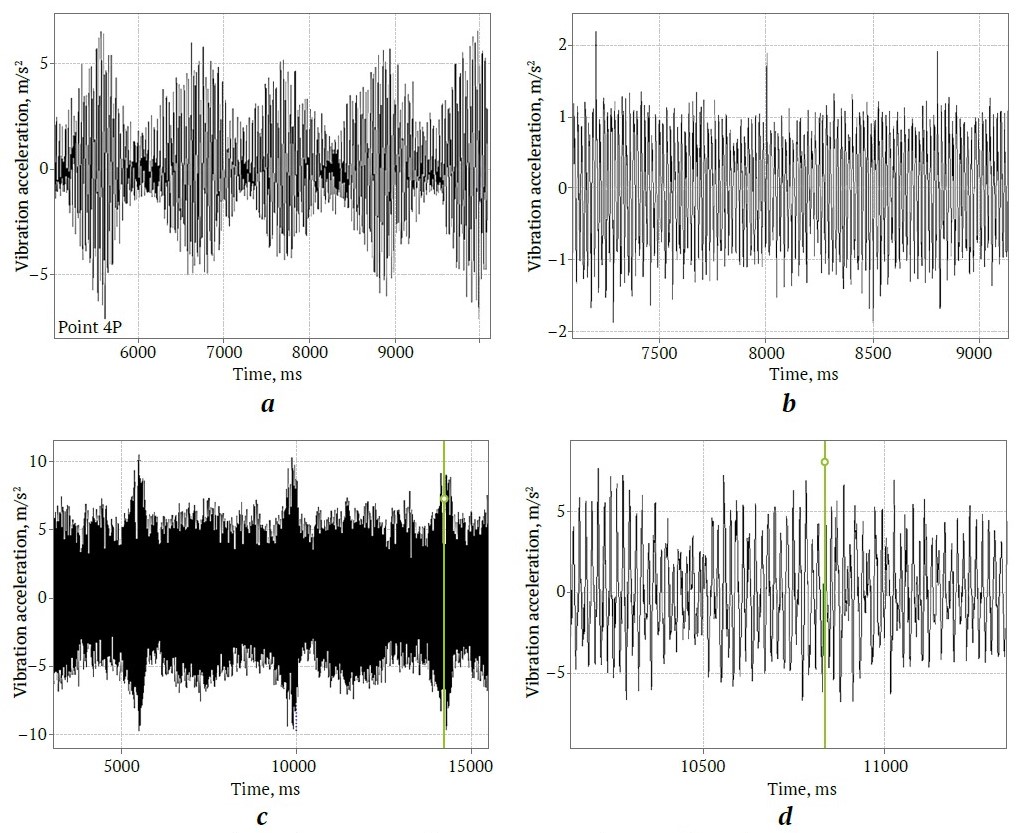
Fig. 5. Beat phenomena: а – clearances in gear mesh sectors; b – tooth spalling; c – bearing damage; d – instability in gear operation
The advantage of a permanent vibration control system lies in its continuous recording of vibration parameters. In this context, one key diagnostic criterion is the stability of the vibration profile. These profiles are unique to each mechanism at a given point in time. For a well-functioning mechanism, spectral pattern changes occur without an increase in component amplitudes; only the frequencies shift. In contrast, a faulty condition is indicated by amplitude growth – first in the higher harmonics, followed by the primary rotational harmonic. Establishing standards for acceptable rates of vibration increase is essential.
The roles of portable and permanent vibration control systems differ significantly. Diagnosis with single-channel or multi-channel portable vibration analyzers provides a static assessment of the equipment’s current state. This method uses the most informative control points and supplements them with additional data from visual inspection, noise analysis, localized temperature measurements, the overall thermal profile, and other organoleptic and instrumental assessments.
A permanent system, however, continuously tracks variations in diagnostic values at control points, offering a dynamic picture of the system’s condition. The absence of visual inspection data, load program details, and maintenance history cannot be fully compensated by even advanced expert modules. Data from permanent systems should therefore complement, rather than compete with, the capabilities of portable systems. Any lack of maintenance history is offset by trend analysis. Here, the analysis duration depends on the diagnostic objectives and the feasibility of acquiring supplementary data. The analysis period is typically limited to the interval between major maintenance events, comparable in scope to overhauls involving key element replacements and restoring operational capacity to at least 80% of its original state.
In this case, trend analysis becomes the primary source of additional information. The following examples pertain to mechanisms like ball mills (Fig. 6), where the motor has a power of 4000 kW, a rotational speed of 75 rpm, and a drum with a diameter of 5.5 m and a length of 6.5 m, rotating at an angular speed of 13.68 rpm. The objective was to identify certain logical rules and dependencies by analyzing trends in the RMS vibration velocity within a frequency range of 10–1000 Hz at control points. The baseline interval is one month.
The number of equipment stops within a month may vary randomly and can reflect certain trends in the technological process or maintenance activities.
It is important to distinguish between short-term stops (Fig. 6, a), brief startups (Fig. 6, b) resulting from disruptions in operational or maintenance processes, preventive stops (Fig. 6c), and extended stops (Fig. 6, d). An additional parameter is the stop type, classified by downtime duration: short-term or extended. These data are used to calculate the availability factor Ka, one of the key reliability indicators of the technical system:
Ka = T/(T + τ), (6)
where Т is the operating time, and τ is the recovery time.
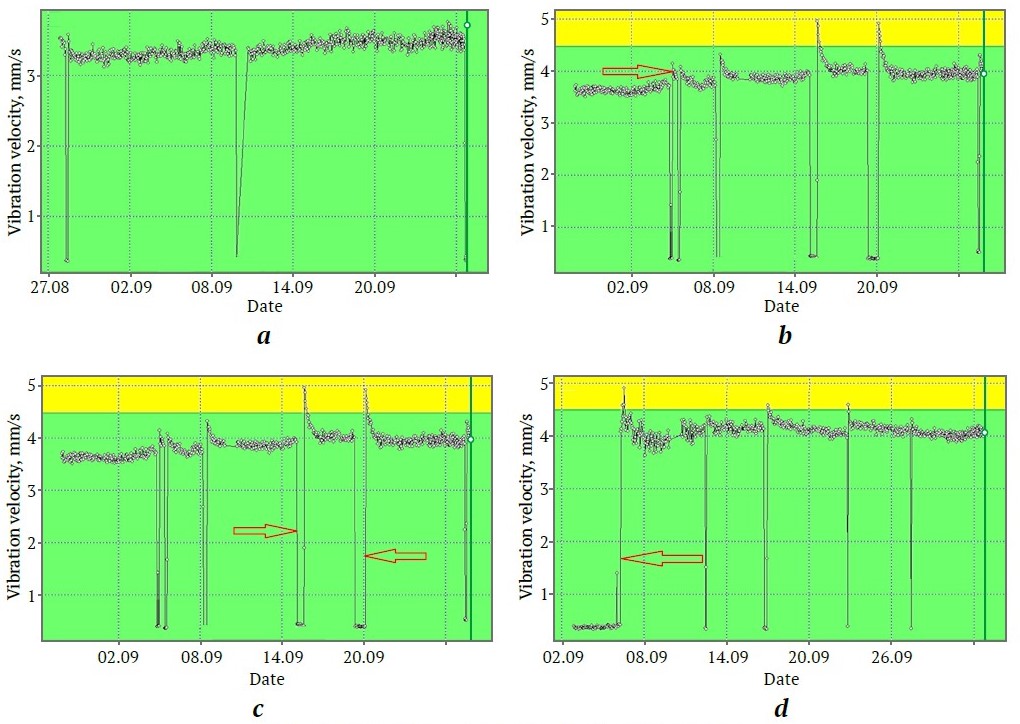
Fig. 6. Stop types: а – short-term stops; b – brief startups; c – preventive stops; d – extended stops
A high number of stops indicates either a persistent issue that is difficult to resolve or the use of these mechanisms as a ‘hot’ standby. In trend analysis (Fig. 7), signs emerge of brief startups and exponential decreases in vibration velocity after startup. These are accompanied by downtimes lasting several days.
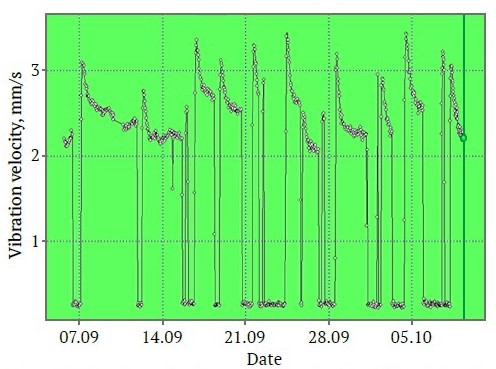
Fig. 7. Vibration velocity trend at point 4P of the ball mill
In extended operation, several modes can be identified (Fig. 8): stable operation (Fig. 8, a), decreasing vibration velocity (Fig. 8, b), increasing vibration velocity (Fig. 8c), and unstable operation (Fig. 8, d). To assess instability, it is essential to consider the range of peak values, as well as the causes of increases and decreases in vibration velocity, recorded at the sensor polling interval of 20 minutes. Analyzing long-term trends can be used to address operational challenges and optimize the operating mode.
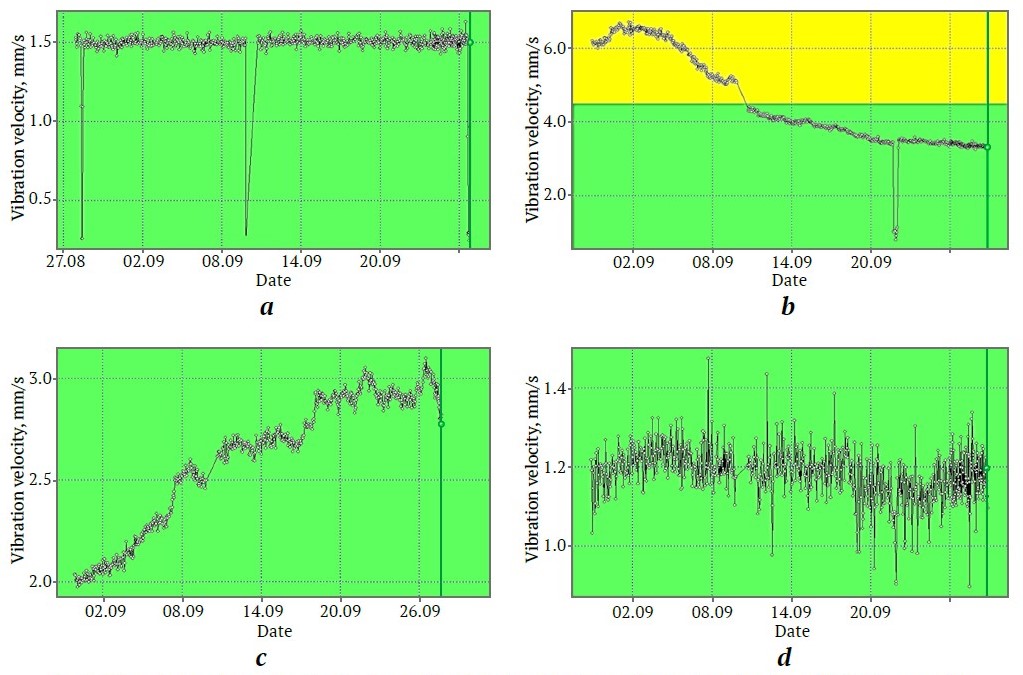
Fig. 8. Operating modes: а – stable; b – decreasing vibration velocity; c – increasing vibration velocity; d – unstable
Each operating mode clearly has its own causes. Stable operation corresponds to the stability of the technical condition and does not require any additional maintenance or repair actions. Decreasing vibration velocity may occur due to ball wear and the resulting decrease in the unbalanced force acting on the mill. Increasing vibration velocity indicates the presence of additional forces or a reduction in bearing support stiffness due to loosening of threaded connections.
General trends may be observed across the entire machine or within specific assemblies. Fig. 9 shows long-term vibration velocity trends at the pinion shaft bearings of the ball mill over an extended observation period (more than two weeks) for several key points, such as 3V, 4V, 3P, and 4P. As seen in Fig. 9, there is a positive trend of decreasing vibration velocity during the observation period.
In the vibration velocity trends, two segments can be identified. The first segment is a descending line, and the second is a sharp drop in vibration velocity readings, which can be attributed to a temporary shutdown of the ball mill's electromechanical system (EMS). After the EMS is restored, the downward trend in vibration velocity resumes. Another diagnostic indicator is the transition of vibration velocity values: from the red zone to the yellow, from the yellow to the green, or remaining within the green zone—the zone of permissible values.
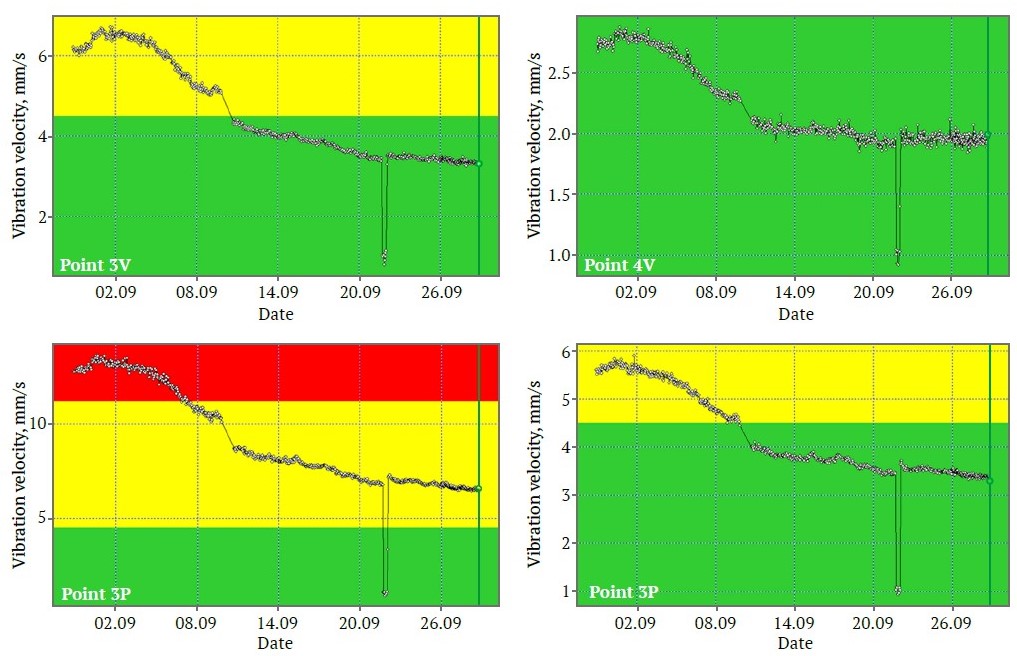
Fig. 9. Vibration velocity trends for the pinion shaft bearing assemblies in September
The examples provided illustrate possible realizations of vibration velocity values over time in a technical system. Key indicators must be formalized and integrated into expert modules to support decision-making. For instance, accumulating data on instances of brief vibration velocity exceedances, introducing a stability indicator, and assessing the post-repair condition. To evaluate the motor’s condition, a vibration sensor should be installed on its housing.
Diagnosis of a ball mill driven by an induction motor
The presence of a gear unit in the design of this mill increases the number of control points for vibration measurement (Fig. 10). Varying replacement intervals for gear wheels7 necessitate high-quality spare part production on equipment from a single manufacturer. The results of overall vibration level measurements are presented in Table 2. Despite the substantial size of the gear unit, vibration levels are relatively high across the entire assembly (acceptable limit: 11.2 mm/s), which may be due to increased compliance of the foundation or the gear pair being manufactured by two different companies.
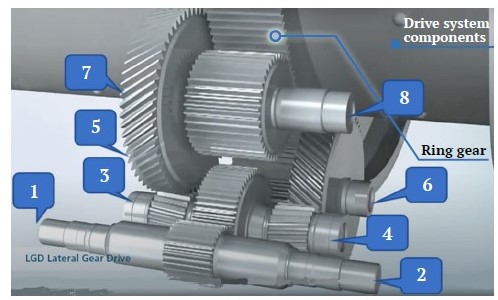
Fig. 10. Arrangement of control points for measuring vibration in the gear unit
Table 2
Vibration parameter values for the gear unit control points of the ball mill
Measurement point | RMS vibration velocity by direction (frequency range 10–1000 Hz), mm/s | ||
Vertical | Horizontal | Axial | |
1 | 6.89 | 9.91 | 12.18 |
2 | 12.73 | 9.55 | 7.01 |
3 | 7.17 | 5.96 | 10.74 |
4 | 7.36 | 9.45 | 10.54 |
5 | 5.64 | 8.00 | 9.54 |
6 | 13.73 | 8.41 | 8.16 |
7 | 4.81 | 7.77 | – |
8 | 9.35 | 7.04 | 11.25 |
The analysis of the overall vibration velocity measurement results indicates that the gear unit is in an emergency state, and operation should cease until the identified defects are resolved. Increased axial vibration suggests the presence of bending during rotation. This is further confirmed by uneven vibration velocity values in two mutually perpendicular directions.
Determining the informative frequencies of potential damage is feasible with a simple calculation, given the known kinematic scheme. We identify the rotational and gear mesh frequencies as follows:
- high-speed shaft: first harmonic – 16.6 Hz, gear mesh frequency – 612 Hz;
- intermediate shaft: first harmonic – 7.6 Hz, gear mesh frequencies – 613 Hz / 174 Hz;
- low-speed shafts: first harmonic – 2.1 Hz, gear mesh frequencies – 174 Hz / 65 Hz.
In examining the direct spectra (Fig. 11), the developed diagnostic rules for identifying spectral patterns were confirmed, though the appearance of a 729 Hz frequency generating a harmonic series was unexpected. The exceeded amplitude of higher harmonics at the 612 Hz gear mesh frequency clearly indicates damage progression. High foundation compliance was confirmed by contour diagram analysis. The 729 Hz frequency was identified as a resonant frequency.
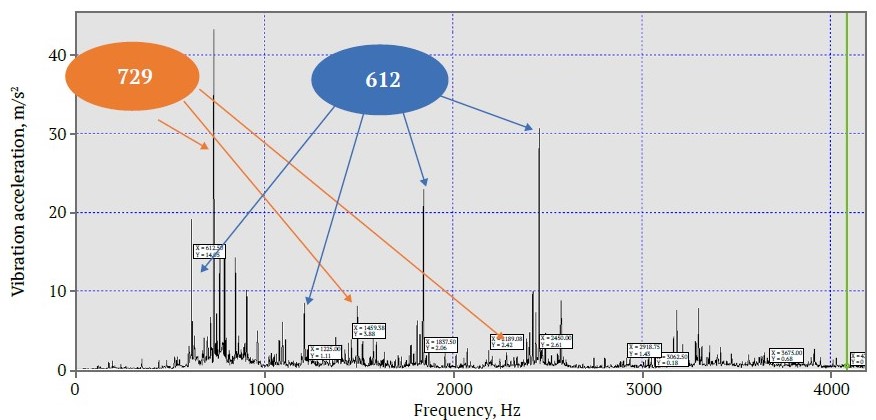
Fig. 11. Direct spectrum of vibration acceleration in the frequency range 10–4000 Hz
Over 10 days of operation, critical increases in vibration were observed at specific frequencies:
- 65 Hz – amplitude 2.0 mm/s, second harmonic at 130 Hz with amplitude 1.5 mm/s: This indicates increased vibration in the gear mesh zone (third and fourth stages), with progressively worsening misalignment;
- 612 Hz – amplitude 9.5 mm/s: A 2.5-fold increase over a short period, suggesting a shift in the technical condition category;
- 1224 Hz (second harmonic of the 612 Hz frequency) – component amplitude rose over 12-fold, from 0.79 mm/s to 9.4 mm/s, indicating increased misalignment or eccentricity in the gear mesh zone;
- 726 Hz – component amplitude remained unchanged, confirming this frequency’s resonant nature.
7 Troshina A. G. Modernization of the drive system of operated horizontal cement mills. Dissertation Abstract for the Candidate of Technical Sciences. Defense Institution: Tula State University, Tula; 2013.
Conclusions
- For the first time, an integrated analysis of the key interrelated parameters of ball mills – Q, P, W, Qmel. The analysis of correlation dependencies for the graphs Q = f(Vb); Р= f(Vb); W = f(Db); and Qmel = f(Vb) enables equipment design and operations specialists to make more informed choices regarding the technical parameters and operating modes of both current and planned-for-commissioning ball mills.
- The combination of shafts with varying rotational frequencies and stiffness in ball mill designs requires individualized determination of technical condition category thresholds. Based on vibration velocity and acceleration trends over time, an analysis is performed to assess the electromechanical system (EMS) components’ susceptibility to damage and operational feasibility under current loads.
- The technical condition of ball mills can be adequately assessed through overall vibration level analysis, direct trends in vibration velocity and acceleration, analysis of time-domain realizations of the vibration signal, and both short-term and long-term trend analysis. Vibration velocity trends displayed in color-coded zones (red, yellow, green) at any given time allow for the assessment of the system's condition and decision-making regarding potential repair actions.
- Combining the capabilities of permanent vibration monitoring with multi-channel portable diagnostic tools provides timely information on equipment condition, allowing for effective planning of maintenance and repair work. Comprehensive conclusions on technical condition require data on production load, electrical load, thermal fields, visual inspections, and completed maintenance and repair activities.
- The examples provided demonstrate the need to classify key trend types and establish logical decision rules for consideration by the expert system in decision-making. To avoid resonant and sub-resonant frequencies in the ball mill EMS, it is recommended to use frequency-controlled drives (FC-IM, FC-SM) for material grinding of specific fractions.
References
1. Rozenberg G. Sh., Madorskij E. Z., Golub E. S. et al. Vibration diagnostics. Monograph. Rosenberg G. Sh. (Ed.) St-Petersburg: St. Petersburg Energy Institute for Advanced Studies; 2003. 284 p. (In Russ.)
2. Shirman A. R., Solovyov A. D. Practical vibration diagnostics and monitoring of the condition of mechanical equipment. Moscow; 1996. 276 p. (In Russ.)
3. Rusov V. A. Spectral vibration diagnostics. Perm: Vibro-Center; 1996. 176 p. (In Russ.)
4. Sharapov R. R. Closed-cycle ball mills. Belgorod: BSTU Publ. House; 2008. 269 p. (In Russ.)
5. Huang P., Jia M., Zhong B. Study on the method for collecting vibration signals from mill shell based on measuring the fill level of ball mill. Mathematical Problems in Engineering. 2014;2014:72315. http://dx.doi.org/10.1155/2014/472315
6. Amosov E. A. Some regularities of ball mills work. Vestnik of Samara State Technical University. Technical Sciences Series. 2012;(1):219–222. (In Russ.)
7. Yoshida T., Kuratani F., Ito T. Taniguc K. Vibration characteristics of an operating ball mill. Journal of Physics Conference Series. 2019;1264(1):012016. http://doi.org/10.1088/1742-6596/1264/1/012016
8. Troshina A. G. Modernisation of drives of horizontal ball mills. Journal Cement and Its Applications. 2009;(3):26–31. (In Russ.)
9. Su Zh., Wang P., Yu X., Lv Zh. Experimental investigation of vibration signal of an industrial tubular ball mill: Monitoring and diagnosing. Minerals Engineering. 2008;21(10):699–710. http://doi.org/10.1016/J.MINENG.2008.01.009
10. Gauthier N. K., Chiementin X., Rasolofondraibe L., Boujelben A. Diagnostic de défauts d'engrenages assisté par jumeau numérique «Application à la surveillance des broyeurs à boulets». May 2022. http://doi.org/10.13140/RG.2.2.28847.41129
11. Logov A. B., Zamaraev R. Yu. Mathematical models for diagnosing unique objects. Novosibirsk: Publ. House SB RAS; 1999. 228 p. (In Russ.)
About the Authors
V. F. BorisenkoRussian Federation
Vladimir F. Borisenko – Cand. Sci. (Eng.), Associate Professor of the Department of Electric Drive and Automation of Industrial Installations
Donetsk
V. A. Sidorov
Russian Federation
Vladimir A. Sidorov – Dr. Sci. (Eng.), Professor of the Department of Mechanical Equipment of Ferrous Metallurgy Plants
Donetsk
Scopus ID 55424503900
A. E. Sushko
Russian Federation
Andrey E. Sushko – Cand. Sci. (Eng.), General Director
Moscow
V. N. Rybakov
Russian Federation
Vyacheslav N. Rybakov – vibration diagnostics of the 3rd level, Head of the Diagnostics Service
Samara
Review
For citations:
Borisenko V.F., Sidorov V.A., Sushko A.E., Rybakov V.N. Vibration metrics for informational support in assessing the technical condition of ball mills. Mining Science and Technology (Russia). 2024;9(4):420-432. https://doi.org/10.17073/2500-0632-2023-10-175


