Scroll to:
Analysis of the mechanism of cyclic geomechanical treatment to increase well productivity in carbonate reservoirs
https://doi.org/10.17073/2500-0632-2024-08-300
Abstract
Methods for creating microfracture zones (loosening of reservoir rock) in well vicinity by significant reducing pore pressure and techniques for increasing well productivity based on these methods have been actively developed by Russian Academy of Sciences institutes over the past decades. A prerequisite for the application of such methods is the creation of a depression of sufficient magnitude and duration in wells to form man-made microfractures. The paper discusses cyclic geomechanical treatment (CGT), one of the methods for increasing the productivity of oil wells in carbonate reservoirs based on the creation of a deep depression in a well. Effective planning and application of such methods requires understanding the mechanism of microfracturing in the vicinity of a well when a critical pore pressure reduction value is reached. The aim of this study is to substantiate the geomechanical mechanism of microfracturing formation consistent with the results of laboratory studies of core samples and the application of CGT and related methods in wells. The objectives of the study included analyzing the characteristics of laboratory experiments and their results, identifying possible mechanisms and criteria for the formation of microfracturing, and conducting coupled hydrogeomechanical modeling with an assessment of the characteristic dimensions of the affected area. It has been shown that the results of the laboratory experiments and experimental application of the CGT method are inconsistent with the shear failure mechanism, but can be explained by the compaction failure mechanism. Coupled numerical hydrogeomechanical modeling of the pilot CGT application in a well was performed with an assessment of the compaction failure criteria parameters based on core data. The estimated radius of the stimulation zone was approximately 7 m, with the estimated increase in the productivity index to be consistent with actual data.
Keywords
For citations:
Indrupskiy I.M., Sukhinina E.A., Alekseeva Yu.V. Analysis of the mechanism of cyclic geomechanical treatment to increase well productivity in carbonate reservoirs. Mining Science and Technology (Russia). 2025;10(2):148-160. https://doi.org/10.17073/2500-0632-2024-08-300
Analysis of the mechanism of cyclic geomechanical treatment
to increase well productivity in carbonate reservoirs
Introduction
Methods for creating microfracturing zones (loosening of reservoir rock) in a well vicinity by significant reducing pore pressure, and techniques for increasing well productivity based on these methods, have been actively developed by Russian Academy of Sciences institutes over the past decades. A prerequisite for the application of such methods is the creation of a depression of sufficient magnitude and duration in wells to form man-made microfractures. The resulting microfracture system significantly increases the permeability of a reservoir rock in a well vicinity zone that leads to a significant increase in well productivity. Such methods are most effective for deep-buried formations (more than 3 km deep) in compacted reservoir rocks with sufficient reservoir pressure reserve. An additional favorable factor for their application is an abnormally high reservoir pressure.
One of the first techniques of influencing a well bottom zone based on the methods under consideration is described in patent1. It is based on the results of laboratory experiments with carbonate rocks of the Tengiz field [1].
The most well-known methods are the geoloosening method and its further modification, the directional unloading of the reservoir (DUR), developed at the Ishlinsky Institute for Problems in Mechanics of RAS2 [2, 3]. To justify the applicability of the DUR method, stresses arising on a wellbore wall (for an open hole design) and at the tip of a perforation (for a cased hole design) are simulated on a core sample in laboratory experiments3 [4]. A distinctive feature of the DUR technique is the need to create additional perforation channels as stress concentrators, including for the open hole design. The technique application allows increasing well productivity by 1.5–2 times for the cased hole design and by 2–4 times for the open hole design4.
An alternative method for creating a microfracturing zone by significant reducing pore pressure is Cyclic Geomechanical Treatment (CGT) method proposed by researchers at the Oil and Gas Research Institute of the Russian Academy of Sciences. The technique for increasing well productivity based on the CGT method is described in patent5. Some practical implementation features are discussed in [5]. The main feature of CGT is a full cycle of the stimulation, including deep decreasing pore pressure and a subsequent increase in the pressure above the initial level to open microfractures. The increase in well productivity (PI – productivity index) as a result of field testing of the method in a formation with an initial reservoir pressure of about 11 MPa is estimated at 44–49%. A description of the programs and results of the laboratory experiments, numerical modeling, and field application is presented in paper [6].
The traditional theoretical explanation for the formation of a zone of increased permeability (microfracturing) due to a significant decrease in pore pressure is based on the mechanism of shear failure. It arises under the influence of excessive tangential stress when the maximum effective stress exceeds the minimum primary effective stress by a critical value6. At the same time, the technique for studying the CGT on core samples used in [6] involved changing only pore pressure at a constant pseudo-triaxial external load that corresponds to constant tangential stresses. Nevertheless, these experiments also detected an increase in the permeability of samples in the course of decreasing pore pressure after reaching its critical value.
The aim of this study is to substantiate the geomechanical mechanism of reservoir loosening consistent with the results of laboratory studies on core samples and the application of the considered methods in wells. The objectives of the study included analyzing the features of the laboratory experiments and their results, identifying possible mechanisms for the formation of microfracturing, and substantiating a geomechanical criterion, followed by the development of a coupled hydrogeomechanical model and calculation of the radius of a well vicinity zone of increased permeability.
1 SU 1609978. Bakirov E. A., Zakirov S. N., Shcherbakov G. A. et al. Method for treating the well bottom zone of a reservoir. Publ. on November 30, 1990. Bulletin No. 44 (In Russ.)
2 RU 2645684 C1. Klimov D. M., Karev V. I., Kovalenko Yu. F., Titorov M. Yu. Method for directed formation relieving. Publ. on February 27, 2018. Bulletin No. 6 (In Russ.)
3 Kovalenko Yu. F. Geomechanics of oil and gas wells. [Diss. ... Dr. Sci. (Phys.&Math.)] Moscow; 2012. 314 p. (In Russ.)
4 Ibid.
5 RU 2620099 C1. Zakirov S. N., Drozdov A. N., Zakirov E. S. et al. Method for increasing the productivity of production wells and the injectivity of injection wells. Publ. on May 23, 2017. Bulletin No. 15. (In Russ.)
6 Kovalenko Yu. F. Geomechanics of oil and gas wells. [Diss. ... Dr. Sci. (Phys.&Math.)] Moscow; 2012, 314 p. (In Russ.); Khimulya V. V. Rheological and filtration properties of rocks under complex triaxial loading. [Diss. ... Cand. Sci. (Phys.&Math.)] 01.02.04. Moscow; 2021. 133 p. (In Russ.)
Theory and Techniques
To analyze possible geomechanical mechanisms of microfracturing formation in a reservoir under the influence of DUR (Directional Unloading of the Reservoir) and CGT methods, we considered the features of the setup and results of laboratory experiments in framework of these methods.
Method of Directional Unloading of the Reservoir
Experiment techniques
The purpose of the laboratory studies using the DUR method is to simulate, on a core sample, the stresses existing on a well wall for an open hole design or on the tip of a perforation for a cased hole design7 [4].
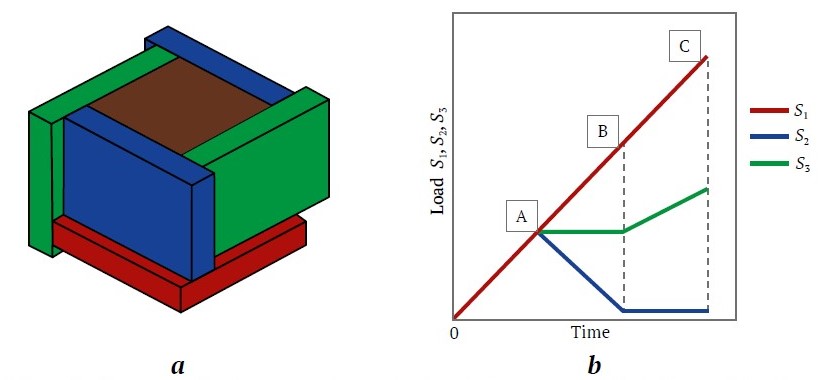
Fig. 1. Schematic diagram of the action on a cubic sample (a) and the stages of loading the sample (b) when modeling the effective stress field in the vicinity of a vertical open hole: S1, S2, S3 are effective normal stresses on the cube faces
Source: Kovalenko Yu. F. Geomechanics of oil and gas wells. [Diss. ... Dr. Sci. (Phys.&Math.)] Мoscow; 2012. 314 p. (In Russ.)
The studies are conducted using a triaxial independent loading test system (TILTS). The TILTS installation creates effective stresses by acting on the faces of a cubic rock sample (Fig. 1, a). The loading stages are shown schematically in Fig. 1, b.
At each of the three stages, the effective stresses change due to external loads on a sample face. Pore pressure is maintained constant at a level of atmospheric pressure (or the first few atmospheres).
Stage 1. A sample is compressed evenly on all sides until the specified effective stress is reached (segment OA in Fig. 1, b). Point A corresponds to the effective stresses Si acting in a rock matrix prior to drilling, under the simplifying assumption that vertical and lateral rock stresses are equal.
Stage 2. The average normal stress S = (S1 + S2 + S3)/3 remains constant throughout the whole stage 2. Each point on segment AB corresponds to the well bottom-hole pressure greater than the formation pressure, i.e., a certain value of repression on the formation. The end point of the stage (point B) corresponds to the state when the well has been drilled and the bottom-hole pressure is equal to the formation pressure.
Stage 3. The process of creating depression, i.e., lowering the bottom-hole pressure (segment BC in Fig. 1, b), is modeled. The third stage continues until the sample is fractured.
During all stages, the sample strain is measured in three directions and its permeability is recorded (through gas pumping). The experiment is described in more detail in the thesis of Yu. F. Kovalenko8.
In total, these three consecutive loading stages correspond to theoretical concepts of changes in effective stresses on the wall of an open hole during the drilling of a productive formation and subsequent creation of a depression. The changes in effective stresses on the surface of perforations for a cased well demonstrate similar regularities. It should be noted that in these studies and those discussed below, it is assumed that Biot’s law for effective stresses is applicable in the Terzaghi form (Biot’s coefficient is equal to 1).
For a vertical open hole in the absence of fluid flow, the solution to the Lame’s problem [7] is valid:
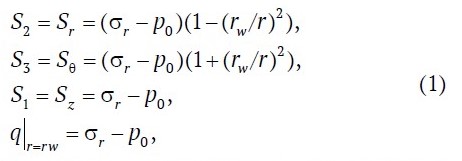
where S1 is effective vertical stress; S2 is effective radial stress; S3 is effective tangential stress in a formation at a distance r from the well axis; rw is the well radius; σr is initial rock (total) stress; p0 is reservoir (pore) pressure; q is maximum effective tangential stress. As the pore pressure p0 decreases, the effective stresses on the wellbore wall r = rw change in accordance with stage 3 of the experiment described (see Fig. 1, b).
7 Kovalenko Yu. F. Geomechanics of oil and gas wells. [Diss. ... Dr. Sci. (Phys.&Math.)] Moscow; 2012, 314 p. (In Russ.); Khimulya V. V. Rheological and filtration properties of rocks under complex triaxial loading. [Diss. ... Cand. Sci. (Phys.&Math.)] 01.02.04. Moscow; 2021. 133 p. (In Russ.)
8 Kovalenko Yu. F. Geomechanics of oil and gas wells. [Diss. ... Dr. Sci. (Phys.&Math.)] Moscow; 2012. 314 p. (In Russ.)
Findings of experiments and their interpretation
The findings of the experiments using the directional unloading of the reservoir method are different for different types of core samples9. As typical examples, the thesis of Yu. F. Kovalenko10 describes the results for sandstone samples with a high clay content and carbonate rock samples.
In the first case, the permeability of the core sample decreased steadily and reached zero by the end of the experiment. In the second case, the effect on the carbonate rock samples resulted in an increase in permeability. The loading stages and the permeability change curve for one of the carbonate samples are shown in Fig. 2.
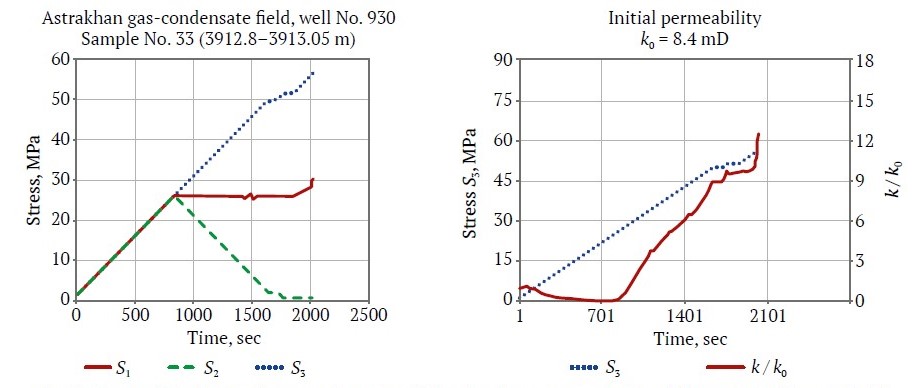
Fig. 2. Stages of loading and change in permeability of carbonate sample (Astrakhan gas-condensate field)
Source: Kovalenko Yu. F. Geomechanics of oil and gas wells. [Diss. ... Dr. Sci. (Phys.&Math.)] Мoscow; 2012. 314 p. (In Russ.)
The first stage, at which triaxial hydrostatic compression on the sample takes place, lasted until the 800th second. By the end of the stage, stress S3 reached a value of 26 MPa. The sample permeability at this point is no more than 10% of the initial value that indicates inelastic strain. When stress S3 exceeds 10 MPa, significant strains develop in the sample, the permeability decreases and drops to almost zero by the 400th second (see Fig. 2, b). This indicates that irreversible changes associated with compaction occur in the sample structure during the hydrostatic compression stage. Consequently, the elastic limit has been exceeded in the sample, and significant compaction has occurred. After 800 seconds, when tangential stresses begin to act on the sample, an intense increase in permeability begins.
It is assumed that the inelastic compaction and accompanying change in the structure of the sample at the first stage of the experiment led to shear fracture with a sharp increase in the sample permeability at the second stage. Otherwise, the failure of the internal structure of the rock would have begun at higher tangential stresses and the permeability would not have increased so significantly.
Thus, the cause of the decrease in sample permeability in the DUR experiments is considered to be elastic and inelastic compaction with an increase in effective stresses, and the cause of the subsequent increase in permeability is shear failure of the internal structure of the sample with the formation of microfractures upon reaching critical tangential stresses.
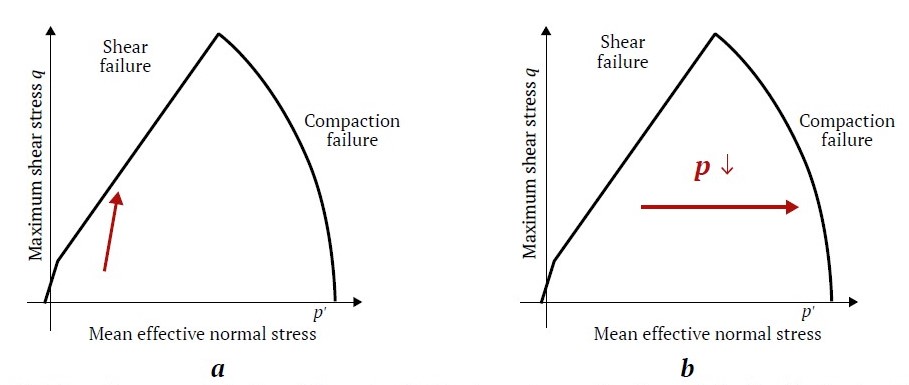
Fig. 3. Failure diagrams and direction of change in effective stresses in experiments simulating the effective stress field in the vicinity of a vertical open hole well (a) and in experiments with changing pore pressure (b)
For porous materials, strain under compression can occur both in the absence of tangential stresses, i.e., under hydrostatic loading (compaction), and in their presence. Then it is called shear-enhanced compaction. The shear failure line for rocks in the “mean normal stress – maximum tangential stress” space can usually be approximated by a straight line according to the Mohr–Coulomb criterion (Fig. 3, a) [7].
In [8], two options for transition from shear-enhanced compaction to inelastic increase of stressed material volume due to fracture formation and opening are considered. The first option consists in applying tangential stresses to a sample from the very beginning of the experiment. The other option is that a sample can be hydrostatically compressed to a state of inelastic compaction strain. Then, when critical tangential stresses are created, sample failure begins. This is exactly the case for describing the above results of the experiment using the DUR technique. The red arrow in Fig. 3 schematically shows the direction of stress change in the experiment.
9 Karev V. I. The influence of stress-strain state of rocks on the filtration process and well flow rate. [Abstr. Dr. Sci. (Eng.) Diss.] Moscow: IPMech RAS Publ.; 2010. 33 p. (In Russ.)
10 Kovalenko Yu. F. Geomechanics of oil and gas wells. [Diss. ... Dr. Sci. (Phys.&Math.)] Moscow; 2012. 314 p. (In Russ.)
Method of Cyclic Geomechanical Treatment (CGT)
Routine of experiments
The essence of the CGT method consists in combining a half-cycle of deep depression to create a zone of loosening of the reservoir, followed by a half-cycle of repression on formation to open and further expand the microfractures created.
Let us consider the peculiarities of the laboratory experiments using the example of studies described in [6]. Carbonate samples from the Tournaisian stage rocks were selected for experiments on cores using the CGT method. Let us consider three cores samples after extraction saturated with kerosene in the presence of connate water saturation. After the experiment, they demonstrated a multiple increase in permeability relative to the initial value. The main characteristics of the core samples are given in Table 1. The other three core samples in the same studies were completely saturated with formation water (brine) model and did not show any increase in permeability. The effect of rock saturation on the nature of permeability changes during CGT tests is a positive factor for application of the method in oil wells [6].
Table 1
Parameters of the Tournaisian stage rock core samples
Sample No. | Depth, m | Lithology | Porosity, % | Gas permeability, mD | Fluid | Residual water content, % |
2 | 1,224.29 | Limestone | 14.24 | 484 | Kerosene | 10.81 |
5k | 1,224.67 | Limestone | 12.88 | 270 | Kerosene | 14.33 |
6 | 1,224.71 | Limestone | 12.31 | 60 | Kerosene | 19.04 |
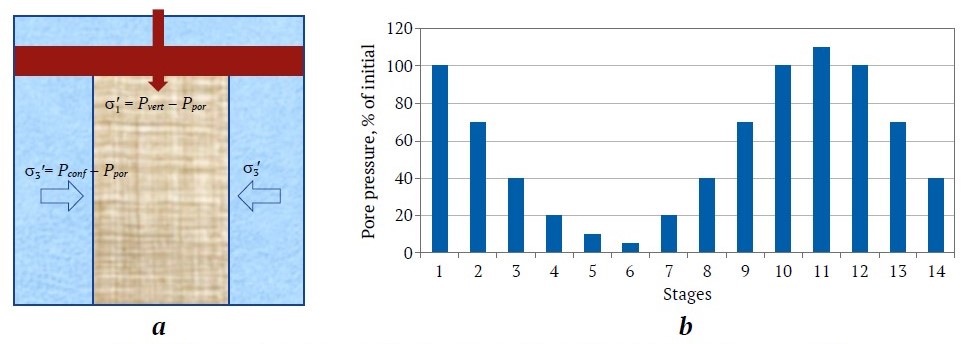
Fig. 4. Schemes of pseudo-triaxial loading in experiments (a) and the experiment stages (b):
σ′i are the effective stresses
The study was performed under pseudo-triaxial compression, simulating the vertical rock stress (axial load on a sample Pvert) and minimal lateral stress (confining pressure Pcomp) typical for the formation. The initial pore (fluid) pressure Ppor corresponded to the initial reservoir pressure of the formation. The experimental conditions are schematically shown in Fig. 4, a. In the experimental process, pore pressure cyclically changed. The stages of the experiment are shown in Fig. 4, b.
At each stage of the experiment, pore pressure was kept constant. The saturating fluid was pumped until the pressure difference stabilized, and the current permeability value was determined. The acoustic method was also used to evaluate the current values of dynamic elastic moduli, Young’s modulus, and Poisson's ratio. The experiment is described in more detail in [6].
Findings of experiments and their interpretation
The results of the experiments for all core samples saturated with kerosene and containing connate water are in agreement at a qualitative level. At the initial stages of pore pressure reduction, rock compaction was observed, accompanied by a decrease in permeability and an increase in Young’s modulus. However, with further growth of compressive stresses and a decrease in pore pressure below the critical level, signs of loosening of the internal structure of the rock were observed. This was followed by an increase in permeability with increasing pressure due to the opening of microfractures that had formed. Besides, in a number of samples, when the initial pressure was exceeded, a characteristic sharp increase in permeability was observed with a decrease in the Young’s modulus, corresponding to the formation of a tensile fracture supported by the previous rock loosening. The permeability increase effect persisted during the stage of secondary pressure decline to initial or lower values. Core samples with reduced Young’s modulus values and increased porosity values (initially more “loose” with probable presence of microfractures) are characterized by a more intense decrease in permeability during the initial pressure reduction. For more tight core samples, on the contrary, the greatest increases in permeability were observed as a result of CGT application [6].
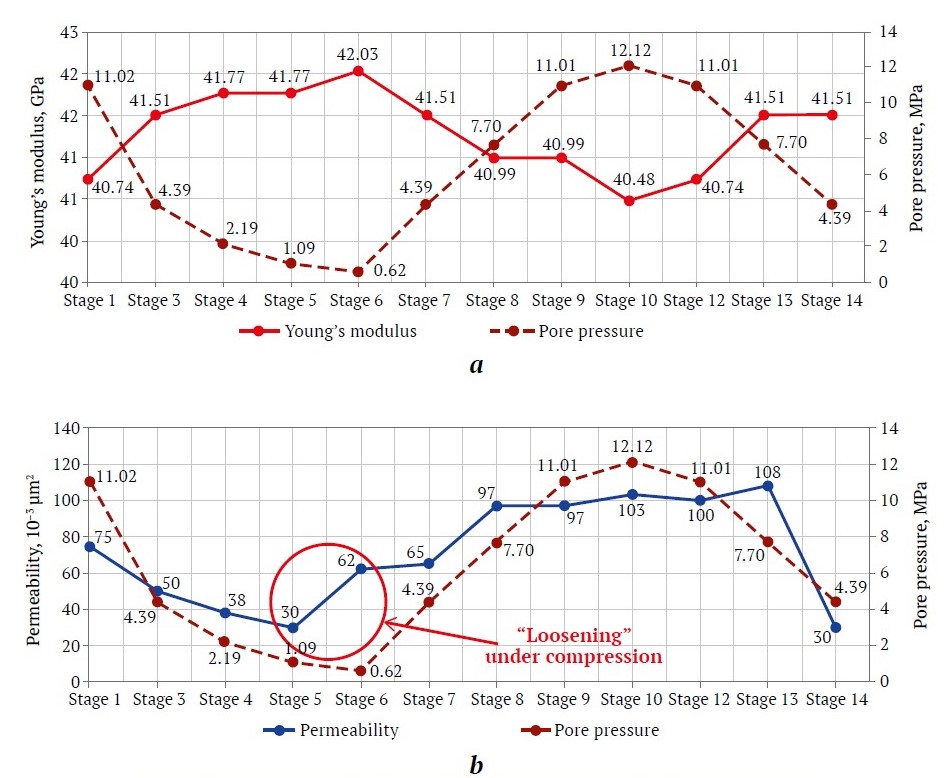
Fig. 5. Laboratory test results for sample 6 (kerosene-saturated with connate water):
a – Young’s modulus plot, b – permeability plot. The red line shows the pore pressure changes
The characteristic plots of Young’s modulus and permeability are shown in Fig. 5 for sample 6.
Let us consider the first six stages of the experiment, corresponding to the half-cycle of pore pressure reduction. Increased permeability in this case indicates exceeding the strength limit in the sample and beginning of the failure of the internal structure.
During the first three stages of the experiment, the increase in Young’s modulus is accompanied by a decrease in permeability, i. e. the sample undergoes compaction. At stage 5, a simultaneous increase in Young’s modulus and permeability takes place, and at stage 6, Young’s modulus decreases that may indicate the formation of fractures in the sample, while the sample structure has become more compact. It should be noted that the joint growth of the Young’s modulus and permeability could have already occurred during stage 4 but not recorded due to the discrete nature of the measurements. So the failure of the internal structure begins during stage 4 or stage 5.
A distinctive feature of the experiments under consideration is that only the pore pressure changes while the confining stress and axial load remain constant. Consequently, there is a synchronous increase in effective normal stresses in all principal directions. At the same time, effective tangential stresses remain constant, so a decrease in pore pressure cannot cause shear failure. Under the influence of increasing effective normal stresses, compaction failure may occur.
In the “mean normal stress – maximum tangential stress” space, the compaction failure line corresponds to an arc of a circle, see Fig. 3, b [7]. The red arrow schematically indicates the direction of change in effective stresses in the experiments.
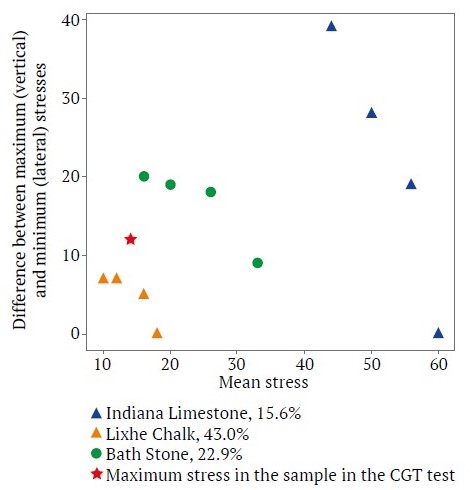
Fig. 6. Compaction failure envelopes according to [8] and ultimate stress state for a Tournaisian stage rock sample
Fig. 6 compares the conditions for internal failure obtained in the experiment described above on a sample from the Tournaisian stage rocks with the compaction failure envelope curves for various carbonate rocks studied in [8]. This type of envelope curve is typical for carbonate reservoirs and is confirmed by lab experiments [9–11] and geomechanical modeling [12]. It should be noted that the increase in Young’s modulus observed in Fig. 5, accompanied by a simultaneous increase in the permeability of the core sample (the beginning of microfracture formation) at the corresponding stage of the experiment, also corresponds to the characteristic features of rock behavior at the onset of compaction failure [13].
In Fig. 6, triangular and circular markers of three colors indicate the results of experimental determination of stress state corresponding to compaction failure for samples of three different carbonate rocks according to data [8]. The horizontal axis corresponds to the mean effective normal stress, while the vertical axis corresponds to the differential stress (the difference between the maximum and minimum normal stresses). The compaction failure envelopes for each of the three rock types are shaped like arcs of circles, with the circles for the orange triangles and green bubbles being similar. The red star marks the point corresponding to the effective stresses at the onset of permeability growth (loosening) in the above experiment on a carbonate rock sample from the Tournaisian stage rock, as described in [6].
Microfractures form primarily in the areas of rock that are characterized by high compaction. The most porous areas are more susceptible to non-elastic compaction. The strength of samples subjected to the experiments with the use of the CGT method could be affected by chemical effects arising from the interaction between the rock and the fluid (kerosene and connate water), as well as by the structural features of the reservoir rock. The presence of heterogeneous inclusions, cavities, and natural fracturing also affects the strength characteristics of the samples. All these factors influence the position of the point for the Tournaisian rock sample in Fig. 6 in comparison with dry carbonate samples of different porosity from [8]. At the same time, one may expect that the shape of the compaction failure envelope will remain unchanged and should pass through the red point in Fig. 6 parallel to the envelopes for the orange and green points.
Thus, in the experiments on CGT considered, the increase in the permeability of samples with a decrease in pore pressure below the critical level cannot be explained by shear failure under the action of tangential stresses. It is probably related to compaction failure. The envelope for compaction failure can be approximately obtained by aligning the obtained critical stress point with the envelope shape characteristic of other carbonate rocks.
Findings
Assessment of the radius of the increased permeability zone during shear failure
The main cause of fracturing in a well vicinity zone when creating a deep depression using DUR and CGT methods is a decrease in local reservoir pressure, which leads to an increase in effective stresses. When using the directional unloading method, low bottomhole pressure must be maintained for a rather long period of time. It is assumed that prolonged depression can cause pressure to drop to a level sufficient to trigger the shear failure at a sufficient distance from the well to achieve a noticeable increase in productivity11. Thus, evaluating the radius of the shear failure zone is important for calculating productivity gains and, consequently, the potential effect from the method application in terms of increasing productivity.
Such evaluation was performed by Yu. F. Kovalenko in his thesis12 for open-hole conditions. The problem is similar to the Lame’s problem, but the pore pressure is not constant; rather, it increases from the well wall toward the remote boundary in accordance with the steady-state solution for axisymmetric inflow with a given depression Δpw (Dupuis solution). Thus, long-term operation of the well at a specified intensive mode is assumed. Rock deformation is considered elastic until the Mohr–Coulomb shear failure criterion is reached. Based on the calculation results, the radius of the failure zone R* is evaluated, where, according to the Mohr–Coulomb criterion, shear failure with the formation of a fracturing region is predicted.
The Yu. F. Kovalenko’s thesis presents graphs of the relative radius of the failure zone R*/Rw (Rw is the well radius) as a function of the internal friction angle at three values of depression Δpw for the characteristic conditions of the Astrakhan oil and gas-condensate field: formation depth of 3,800–3,900 m, initial reservoir pressure of 60 MPa, vertical overburden stress of 90 MPa.
The results of the calculations from the Yu. F. Kovalenko thesis show that, with values of internal friction angle characteristic of real rocks of 15° and above, the calculated radius of the failure zone does not exceed 3–4 times the radius of the well (~30–40 cm) even at a depression of 60 MPa.
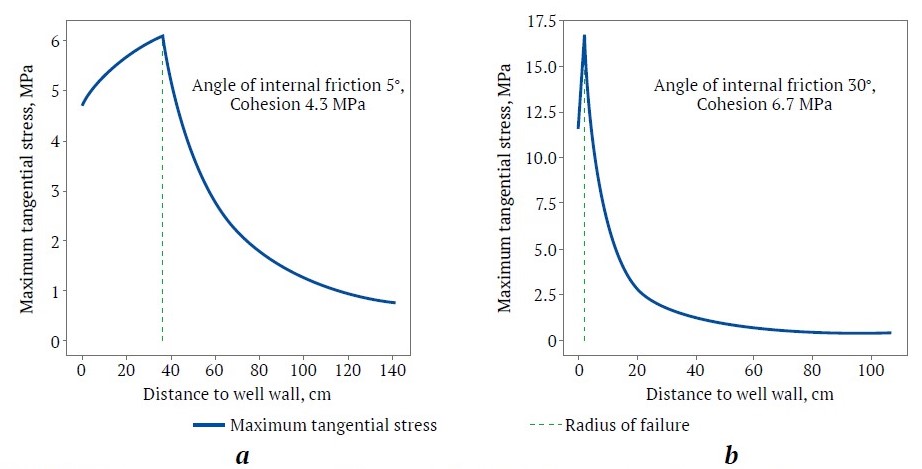
Fig. 7. Distribution of maximum tangential stresses in the vicinity of open-hole well for the following parameters:
Poisson’s ratio – 0.25; overburden rock stress – 26.06 MPa; initial pore pressure –11.0 MPa; depression – 10 MPa;
wellbore radius – 0.1 m
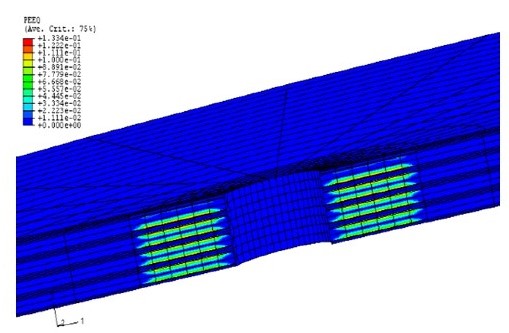
Fig. 8. Numerical solution of the problem of stress distribution in the vicinity of perforation channels at a perforation density of 8 perforation holes per 0.3 m for a cased well. The blue color indicates the elastic zone, while other colors indicate the zone where the shear failure criterion is met [15]
Using the model developed by Yu. F. Kovalenko, the authors performed similar calculations for the initial data corresponding to the characteristic conditions of the Tournaisian stage carbonate reservoirs (formation depth of 1,200 m, initial reservoir pressure of 11 MPa, vertical overburden stress of 26.06 MPa, depression of 10 MPa). Fig. 7 shows graphs of maximum tangential stresses as a function of the distance from the well wall. The peak point corresponds to the boundary of the failure zone.
As can be seen in Fig. 7, a, even in the case of underestimated values of the cohesion coefficient and internal friction angle, the radius of the failure zone is about 35 cm from the well wall. For more typical parameter values (Fig. 7, b), it decreases to about 5 cm.
More complex features are characteristic of a formed failure zone for a cased well with perforation. In the V. V. Khimulya’s thesis13, the stress at the tip of a single perforation channel was evaluated using an analytical solution for a spherical cavity filled with a pressurized fluid [14]. The distribution of stresses in a well vicinity zone, taking into account the interference of perforation channels, can be assessed based on the results of numerical calculations published in the literature. The paper [15] examined the stability of a wellbore under different perforation densities across the formation thickness. Fig. 8 shows the failure region at a perforation density of 8 perforation holes per 0.3 m. The blue area indicates the elastic zone, while the green area indicates the failure zone. As can be seen from the Fig. 8, the tangential stresses are high enough to cause failure along the perforation hole, but it does not propagate into the formation outside the perforation zone. The stress field poses a high risk of damaging the cement column of the wellbore, but does not create conditions for the formation of an extended failure zone, which could cause the significant increase in productivity when using the DUR method in similar conditions.
The simulation results presented below confirm that the estimates of the fracture zone size during shear failure (Figs. 7 and 8) cannot explain the achieved increases in the productivity index: 1.5 times during experimental testing of the CGT method (for a cased wellbore in shallow Tournaisian stage rocks [6]), and up to 3–4 times using the DUR method (for an open-hole wellbore, with additional perforation and in conditions of deeper sediments with a large reservoir pressure reserve14).
11 Kovalenko Yu. F. Geomechanics of oil and gas wells. [Diss. ... Dr. Sci. (Phys.&Math.)] Moscow; 2012, 314 p. (In Russ.)
12 Ibid.
13 Khimulya V. V. Rheological and filtration properties of rocks under complex triaxial loading. [Diss... Cand. Sci. (Phys.&Math.)] 01.02.04. Moscow; 2021. 133 p. (In Russ.)
14 Kovalenko Yu. F. Geomechanics of oil and gas wells. [Diss. ... Dr. Sci. (Phys.&Math.)] Moscow; 2012, 314 p. (In Russ.)
Coupled hydrogeomechanical modeling: evaluation of the radius of the increased permeability zone formed during compaction failure when using the CGT method
It has been shown above that the results of laboratory experiments on the CGT under constant pseudotriaxial loading with changing pore pressure can be explained by the action of inelastic compaction mechanisms followed by compaction failure. To simulate the corresponding effects in a well vicinity zone when creating a depression in a well, the tNavigator flow simulation software package from Rock Flow Dynamics company (RFD) was used15. It enables the numerical solution of multiphase fluid flow problems in a reservoir during field development, together with the solution of a simplified geomechanical problem concerning changes in stress and strain distribution in reservoir rocks.
In the RFD tNavigator, there are two ways to solve flow and elasticity problems jointly: coupled and modular. The coupled approach was used, in which a single system of equations describing flow processes in the formation (continuity equations taking into account Darcy’s law) and geomechanical effects (in this case, Lame’s equations taking into account Hooke's law) is solved on a single computational grid16.
To account for the effects of inelastic compaction and compaction failure, a script has been implemented in the Python language built into tNavigator, which processes the current effective stress fields at each computation step. The compaction was set by adjusting the current permeability multiplier in a grid cell (relative to the initial value) depending on the average effective normal stress. The corresponding decreasing dependence was assumed based on the first stages of the laboratory experiment (see Fig. 4, stages 1–5).
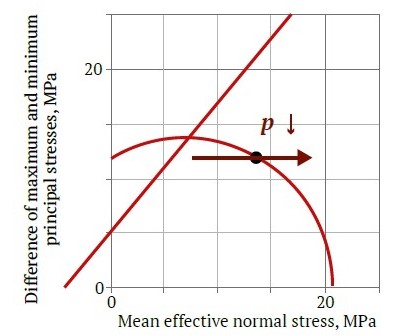
Fig. 9. The envelope for the compaction failure criterion and the criterion's activation point obtained experimentally, as well as the Mohr-Coulomb straight line for shear failure
The compaction failure criterion under current changes in effective stresses in the grid cell was controlled by intersecting the envelope curve passing through the experimental point corresponding to the increase in permeability in the laboratory experiment (red dot in Fig. 6). The shape of the envelope curve was adopted by analogy with the experimental data from [8] (see Fig. 6). Fig. 9 shows an example of an envelope curve for one of the samples, approximated with sufficient accuracy by a circular arc with selected parameters, in this case, with the radius in stress coordinates of 13.4 MPa and the center at the point: 7 MPa; 0 MPa. Fig. 9 also shows the Mohr-Coulomb straight line for the shear failure criterion, which was not achieved in the computations. The burgundy horizontal arrow indicates the direction of change in effective stresses as pore pressure decreases.
When the compaction failure criterion was met (intersection of the envelope curve), the cell permeability increased fourfold that corresponds to the final increase in permeability after CGT application according to the results of one of the experiments on the Tournaisian stage rock core samples.
The characteristics of a Tournaisian stage reservoir in one of the fields in the Republic of Tatarstan were used as input data for modeling. The reservoir model had horizontal dimensions of 2,000 × 2,000 m, a nominal thickness of 1 m, with a vertical well located in the center. Along the axes Ox and Oy, the grid was densified towards the well with a constant coefficient of 1.1. The minimum cell size (the central cell with a well) was 0.5 × 0.5 m.
The parameters of the reservoir and fluids were set in accordance with the characteristics of the accepted Tournaisian stage reservoir. The flow was assumed single-phase (oil). The boundary conditions at the outer boundaries of the model corresponded to no-flow condition and constant vertical and lateral rock stresses. The oil flow rate corresponding to the maximum possible depression for a given reservoir was set at the well.
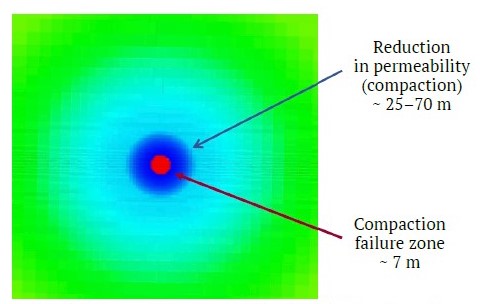
Fig. 10. Permeability multiplier distribution based on the computations using a coupled model in tNavigator (hydrodynamics + geomechanics) with a script to account for compaction and compaction failure through effective stress analysis. The colors are explained in the text
The central fragment of the permeability multiplier distribution obtained as a result of the modeling is shown in Fig. 10. The area with the initial permeability value (multiplier 1) is marked in green. The blue shades indicate the region of compaction. The average decrease in permeability in the blue zone (the radius of approx. 70 m) is ~5%, and that in the dark blue zone (the radius of approx. 25 m) is ~8%.
The red area shows the failure zone (the radius of approx. 7 m), where permeability increased fourfold as a result of the compaction failure criterion being triggered.
Thus, for the conditions of the Tournaisian formation, through the mechanism of compaction failure, which allows explaining the results of the CGT laboratory experiments, the origination of a well vicinity zone of increased permeability with a radius of about 7 m is predicted. This value is at least 20 times greater than the radius of the similar zone predicted based on the shear failure mechanism (see Fig. 7).
15 TNavigator 23.1. Technical manual for the Simulator. RFD; 2023.
16 Ibid.
Findings discussion and practical application
Let us compare the evaluated size of the loosening zone (~7 m) obtained through simulation of CGT application with the actual results of applying this method in a well exploiting the Tournaisian formation [6].
Let us determine the calculated increase in the well productivity index. The magnitude of the skin factor formed as a result of CGT application can be approximately estimated using the well-known formula for a two-zone axisymmetric reservoir:

where rs is the radius of the near zone with permeability ks, rs = 7 m; rw is the radius of the well, rw = 0.1 m; k/ks is the ratio of permeability in the remote zone (unchanged formation) to permeability in the near zone (fractured zone), k/ks = 1/4. The effect of compaction outside the fractured zone can be neglected due to its minor impact on the average permeability of the remote zone (the first few percents).
The skin factor value obtained allows estimating the increase in the PI (productivity index) relative to its initial value PI0. For a perfect well and a nominal external boundary radius re = 500 m, using Dupuis' formula, one obtains:
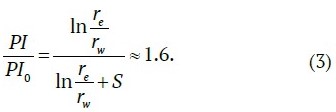
Thus, modeling the CGT application effect based on the compaction failure mechanism provides an approximate estimate of the increase in well productivity index by a factor of 1.6. This estimate is consistent with the actual productivity increase of 1.45–1.5 times obtained during field tests in the Tournaisian reservoir [6]. It should be noted that, since the mechanism of compaction failure is determined mainly by the increase in average effective normal stresses due to a decrease in pore pressure, a different type of well completion (cased well with perforation) does not significantly affect the assessment of the effect.
The value of 1.6 obtained using the compaction failure criterion also fully corresponds to the results of the hydrodynamic calculations performed in [6], where the increase in permeability from the CGT application was set depending on the pore pressure, without analyzing geomechanical effects.
At the same time, it is clear from formulas (2), (3) that the sizes of the loosening region obtained by the shear failure mechanism (see Figs. 7 and 8) cannot explain the actual increase in the productivity index in the experimental application of the method described in [6].
Conclusions
The analysis presented in this paper allows drawing a number of conclusions regarding the probable geomechanical mechanism of formation of a well vicinity zone of increased permeability when creating a deep depression using the CGT method and the related DUR method.
- Laboratory experiments on the TILTS installation simulate loading conditions corresponding to the stress state on the wall of an open-hole wellbore or a perforation channel. It is assumed that the well vicinity zone of increased permeability arises due to shear failure as tangential stresses increase. Estimates of the extent of this effect do not exceed 30–40 cm from the wellbore wall, at least for the typical parameters and reservoir conditions of carbonate reservoirs in the Ural-Volga region.
- The effect of permeability increase when creating a critical depression in laboratory experiments with constant pseudo-triaxial loading and changes in pore pressure can be explained by the mechanism of compaction failure due to an increase in effective normal stresses.
- According to the results of coupled hydrogeomechanical modeling for typical conditions of the Tournaisian reservoirs in the Republic of Tatarstan, taking into account the effects of inelastic compaction and compaction failure through the analysis of effective stresses, a well vicinity microfracturing zone (increased permeability zone) reaches ~7 m. This is at least 20 times greater than the area predicted based on the shear failure mechanism.
- Taking into account the permeability increase according to the laboratory data, the estimated size of the fractured zone based on the compaction failure mechanism is consistent with the productivity increase observed in the field test on the well.
Thus, the results of this study improve understanding of the geomechanical mechanism of increasing permeability in a well vicinity zone due to applying the CGT method and other methods based on the creation of deep depression. This will enable more accurate predictions of the expected effect based on laboratory studies and modeling, and also improving the effectiveness of the methods for increasing well productivity and oil recovery from carbonate reservoirs.
References
1. Zakirov S. N. Development of gas, gas-condensate, and oil-gas-condensate fields. Moscow: Struna Publ. House; 1998. 628 p. (In Russ.)
2. Khristianovich S. A., Kovalenko Yu. F., Kulinich Yu. V., Karev V. I. Oil well productivity enhancement using geoloosening. Oil and Gas Eurasia. 2000;(2):90–94. (In Russ.)
3. Klimov D. S., Kovalenko Yu. F., Karev V. I. Implementation of the geoloosening method to increase the injectivity of an injection well. Tekhnologii Toplivno-Energeticheskogo Kompleksa. 2003;(4):59–64. (In Russ.)
4. Karev V.I., Kovalenko Y.F., Khimulia V.V., Shevtsov N.I. Parameter determination of the method of directional unloading of the reservoir based on physical modelling on a true triaxial loading setup. Journal of Mining Institute. 2022;258:906–914. https://doi.org/10.31897/PMI.2022.95
5. Zakirov S. N., Drozdov A. N., Zakirov E. S. et al. Technical and technological aspects of geomechanical impact on a formation. Neftegaz.RU. 2018;(6):24–29. (In Russ.)
6. Indrupskiy I. M., Ibragimov I. I., Tsagan-Mandzhiev T. N. et al. Laboratory, numerical and field assessment of the effectiveness of cyclic geomechanical treatment on a tournaisian carbonate reservoir. Journal of Mining Institute. 2023;262:581–593. https://doi.org/10.31897/PMI.2023.5
7. Fjær E., Holt R. M., Horsrud P. et al. Petroleum related rock mechanics. 2nd edition. Elsevier; 2008. 492 p.
8. Vajdova V., Baud P., Wong T.-F. Compaction, dilatancy, and failure in porous carbonate rocks. Journal of Geophysical Research. 2004;109:B05204. https://doi.org/10.1029/2003jb002508
9. Sari M., Sarout J., Poulet T. et al. The brittle–ductile transition and the formation of compaction bands in the Savonnières limestone: impact of the stress and pore fluid. Rock Mechanics and Rock Engineering. 2022;55:6541–6553. https://doi.org/10.1007/s00603-022-02963-z
10. Ji Y., Stephen H. A., Baud P., Wong T.-F. Characterization of pore structure and strain localization in Majella limestone by X-ray computed tomography and digital image correlation. Geophysical Journal International. 2015;200:700–719. https://doi.org/10.1093/gji/ggu414
11. Baud P., Vinciguerra S., David C. et al. Compaction and failure in high porosity carbonates: mechanical data and microstructural observations. Pure and Applied Geophysics. 2009;166:869–898. https://doi.org/10.1007/s00024-009-0493-2
12. Stefanov Yu P., Chertov M. A., Aidagulov G. R., Myasnikov A. V. Dynamics of inelastic deformation of porous rocks and formation of localized compaction zones studied by numerical modeling. Journal of the Mechanics and Physics of Solids. 2011;59:2323–2340.
13. Chen X., Roshan H., Lv A. et al. The dynamic evolution of compaction bands in highly porous carbonates: the role of local heterogeneity for nucleation and propagation. Progress in Earth and Planetary Science. 2020;7(28). https://doi.org/10.1186/s40645-020-00344-0
14. Timoshenko S. P., Goodier J. Theory of elasticity. 3rd ed. N.-Y.: McGraw-Hill; 1970. (Trans. ver.: Timoshenko S. P., Goodier J. Theory of elasticity. Moscow: Nauka Publ. House; 1979. 560 p. (In Russ.))
15. Zhang J., Standifird W. B., Shen X. Borehole stability in naturally deformable fractured reservoirs – a fully coupled approach. In: SPE Annual Technical Conference Exhibition. Scheveningen, The Netherlands, May 30, 2007. https://doi.org/10.2118/107785-MS
About the Authors
I. M. IndrupskiyRussian Federation
Ilya M. Indrupskiy – Dr. Sci. (Eng.), Deputy Director for Research, Leading Researcher
Moscow
Scopus ID 14015783600
ResearcherID G-2176-2014
E. A. Sukhinina
Russian Federation
Ekaterina A. Sukhinina – Student
Moscow
Yu. V. Alekseeva
Russian Federation
Yulia V. Alekseeva – Junior Researcher
Moscow
Review
For citations:
Indrupskiy I.M., Sukhinina E.A., Alekseeva Yu.V. Analysis of the mechanism of cyclic geomechanical treatment to increase well productivity in carbonate reservoirs. Mining Science and Technology (Russia). 2025;10(2):148-160. https://doi.org/10.17073/2500-0632-2024-08-300


