Scroll to:
Assessment of rating parameters of the rock mass conditions at Udachny underground mine deep levels
https://doi.org/10.17073/2500-0632-2023-12-192
Abstract
Geotechnical rating classification systems of rock masses are an important tool in the design of underground mining systems. They are especially relevant at the early stages of project development, when primary mining and geological information is available to a limited extent. The presented work shows an approach to the collection of initial information and calculation of RMR (Rock Mass Rating) and Q Index for the rock mass of deep levels of the Udachny underground mine exploiting the kimberlite pipe of the same name. Since the classifications are multi-component systems, they impose heavy demands on the scope and quality of primary data, which can be met by applying an integrated data collection system. The bulk of these were obtained by acoustic televiewer tool (ATV) combined with geologic and structural logging of non-oriented core. Data on physical and mechanical properties of rocks, stress-strain state, and hydrogeological conditions were also used. The ratings were calculated interval by interval along holes, in which acoustic logging was performed. The acoustic wave amplitude parameter, which depends on the physical properties of a rock mass and the degree of its structural disturbance, was proposed as one of the criteria for distinguishing geotechnical intervals. The moderate level of correspondence between Q and RMR systems was established to be due to the different “sensitivity” and structure of the input parameters. Using the calculated ratings, the rock masses of ore bodies and host sediments were evaluated for stability (classes/categories have been assigned), and the optimal method and parameters of workings support were determined. The geotechnical database accumulated during the research process provides the feasibility of calculating alternative ratings such as MRMR, RMi, GSI, etc., without the use of transient equations.
Keywords
For citations:
Serebryakov E.V., Zaytsev I.A., Potaka A.A. Assessment of rating parameters of the rock mass conditions at Udachny underground mine deep levels. Mining Science and Technology (Russia). 2024;9(3):206-220. https://doi.org/10.17073/2500-0632-2023-12-192
Assessment of rating parameters of the rock mass conditions at Udachny underground mine deep levels
Introduction
Rating classifications in their current form were formed as a result of accumulation of huge practical experience of specialists, accumulated in the course of comprehensive study of rock masses in a variety of mining and geological conditions. Despite the widespread introduction of numerical simulation methods developed back in the 1970s, rating classifications do not lose their relevance even nowadays, being used as a means of short-term prediction of rock mass behavior. In the world mining practice the following geotechnical classifications are most widely used: Rock Mass Rating RMR [1, 2], rock mass quality index for underground mining Q (the Norwegian Geotechnical Institute Tunneling Quality Index), Barton [3, 4], mining rock mass rating MRMR [5, 6], geological strength index GSI [7, 8]. In their structure, the classifications take into account to some extent all the characteristics of a rock mass that can potentially reduce its strength compared to the initial strength of intact rock. These characteristics include: physical and mechanical properties of rocks, the degree of disturbance of a rock mass by structural defects (faults, joints, layering elements), frictional properties of the structural defects, as well as water content and stress-strain state of a rock mass.
Since the classifications are multi-component systems, they impose heavy demands on the scope and quality of primary data, which can be met by applying an integrated data collection system. For early stages of design, a high level of quality and promptness in their collection is provided by an integrated study, including televiewer logging combined with the results of non-oriented core logging [9, 10]. A similar integrated study was applied in the collection of initial data for the calculation of RMR and Q rating parameters for deep levels of the Udachny underground mine. The main findings of the conducted research are presented in this paper.
Subject of research
The Udachnaya kimberlite pipe is one of the largest diamond deposits, which is currently being exploited by underground mining. The deposit is represented by two pillar-shaped ore bodies – Udachnaya-Zapadny (Zapadny Ore Body, ZOB) and Udachnaya-Vostochny (Vostochny Ore Body, VOB), composed of a typical formations for pipes of the Yakutsk diamondiferous province: porphyritic kimberlite of early generations and autolithic kimberlite breccia of the final stages of magmatism [11]. The rocks of the sedimentary complex hosting the pipe, as well as halogenic sediments occur as xenoliths. The sedimentary xenoliths predominantly occur within the ZOB, where they form so-called floating reefs [12]. The thick salt deposits within the kimberlite pipe are a unique feature of the structure of the Zapadny ore body. A possible process responsible for the presence of the salts in the pipe is the alteration of the deposit kimberlites by external saline groundwater [13]. The pipe is hosted by carbonate and carbonate-clayey rocks (limestones, dolomites, marls) of Early-Late Cambrian.
The open-pit development of the deposit was carried out until 2014. The depth of the open pit was 640 m, the bottom elevation was −320 masl. Stripping and mining of the reserves of the first stage below the pit bottom up to −580 masl is currently performed by underground method by the system of induced block caving/sublevel caving. Preparation of the second stage reserves occurring between −580 and −1080 masl levels is carried out by drilling deep holes from underground mine workings.
Methodology of data collection and analysis
The procedure for determining the rating parameters of a rock mass is quite simple and boils down to assigning a certain score (from existing tabular forms) for one or another type of source data and performing the required mathematical operations with these values to obtain the desired values of the final rating. The RMR classification system was developed in 1973 by Bieniawski [1] and has undergone several modifications over the years, the latest of which was implemented in 2014 [14]. The RMR rating is calculated using the following formula:
RMR = JA1 + JA2 + JA3 + JA4 + JA5 + JB , (1)
where JA1 is rating of rock mass strength; JA2 is rating of rock mass quality; JA3 is rating of joint spacing in a rock mass; JA4 is rating of joints characteristics; JA5 is rating of rock mass water content; JB is rating of joints orientation in relation to an excavation axis.
The JA4 rating characterizing a rock mass jointing is determined by the following expression:
JA4 = JA4/1 + JA4/2 + JA4/3 + JA4/4 + JA4/5, (2)
where JA4/1 is joint roughness rating; JA4/2 is joint length rating; JA4/3 is joint aperture rating; JA4/4 is joint mineral infilling rating; JA4/5 is joint wall weathering rating.
The index of rock mass quality in underground mining Q (the Norwegian Geotechnical Institute Tunneling Quality Index) was proposed by Barton N., Lien R., Lunde J. in 1974 [3]. Q value ranges from 0.001 to 1000 on a logarithmic scale and is determined by the following formula:

where RQD – rock mass quality; Jn – number of joint systems; Jr – joint roughness; Ja – degree of joint wall alteration and mineral infilling (joint cohesion); Jw – rock mass water content; SRF – stress reduction factor.
The simplicity of the calculations for determining the rating parameters implies high requirements to the quality and completeness of the initial data. In the present work, the initial geological and structural data was collected by drilling 73 vertical and slightly inclined holes within the ore bodies with access to the host sediments (Fig. 1). The holes were drilled from −465 masl level. This drilling campaign was performed with complete sampling of non-oriented core.
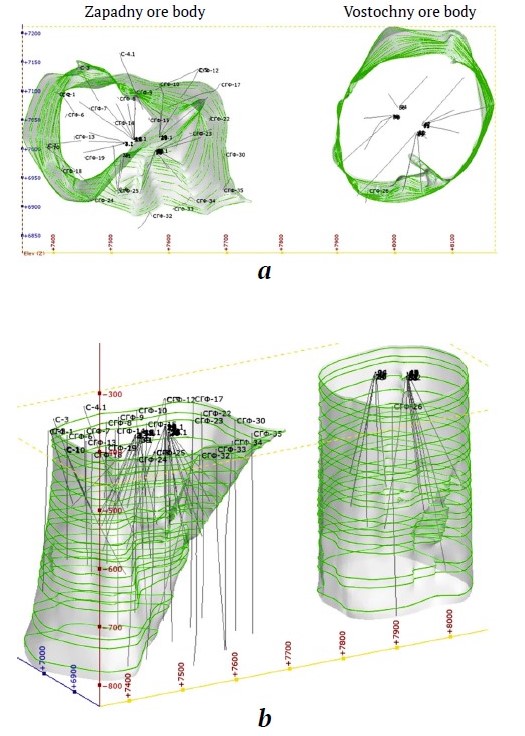
Fig. 1. Location of the holes used for televiewer logging:
a – plan view; b – view from the south-west. Depth interval: −465 ... −850 masl
The strength properties of the kimberlite and host sediments rock mass were determined based on the results of laboratory tests of core samples. The samples were collected from the kimberlite, host sediments (dolomite, limestone), and the host sediment xenoliths. The tests were carried out in the Geotechnics laboratory of Yakutniproalmaz Institute according to the methods set forth in GOST (GOST 21153.2–84 Rocks).
Structural disturbance of the rock mass was established by means of televiewing (acoustic) logging of geotechnical holes. Field geophysical works were carried out by specialists of Botuobinskaya exploration expedition using QL-40ABI probe jointly produced by Advanced Logic Technology and Mount Sopris Instruments.
The principle of an acoustic televiewer operation is continuous ultrasonic scanning of a hole walls along its entire depth [15, 16]. The acoustic wave generated by the transmitter travels from the instrument to the contact with a rock, the reflected echo signal returns and, passing through the acoustic window, is picked up by the acoustic sensor (Fig. 2).
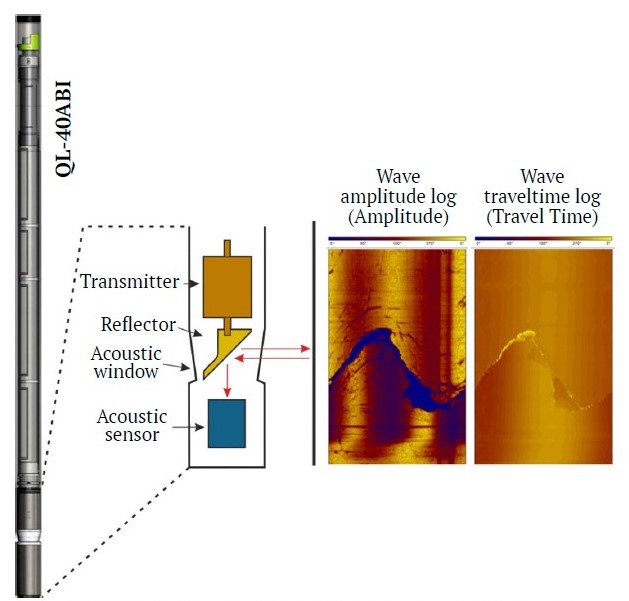
Fig. 2. Schematic diagram of an acoustic televiewer
The instrument records the amplitude of the acoustic wave and the time it takes for the emitted signal to travel from the acoustic window to a hole wall and back during the scanning process, and logs this data along the hole (see Fig. 2). Flat structures (joints, veins, layers, etc.) are converted into sinusoids (Figs. 2, 3) as a result of a hole cylinder scanning during log processing, and the amplitude of the sinusoids indicates the dip angle of a structure. The greater the amplitude, the steeper the dip angle. Due to the built-in high-precision positioning module, which includes a three-axis ferro-probe magnetometer and accelerometer, an oriented in space image is obtained, which makes it possible to automatically determine true dips and strikes of joints.
Interpretation of the results of the televiewer studies was carried out by the paper authors in the WellCAD program software1. In addition to the logs themselves, the results of structural and photo logging of core were also included in the processing. Using the latter, the Core Image Cropper module generated a single log of photos positioned along a hole and georeferenced in depth. This allowed further comparison of logging results with drilling data and rejection of incorrectly recorded joints. The direct distinguishing and characterization of joints was performed in the ISI (Image & Structure Interpretation) module. Four main types of structures were defined and the first of these was an open joint. It is characterized by low wave amplitude and increased time for which the wave travels from the instrument to a hole wall and back, compared to an intact fragment [17]. In this case, on the acoustic caliper plot, a large anomaly will correspond to the area of an open joint (Fig. 3, а).
The second type of structures is a partially open joint. Visually in the amplitude field it is similar to a fully open one, but in the time field it does not have a single pronounced anomaly. The third type of structure, closed joints, is characterized by the absence of any anomalies in the wave traveltime log and caliper log. At that, such joints are displayed as thin lines of reduced amplitude values. Joint infilling also affects their visualization in logs. For instance, structures filled with solid minerals, due to the impedance difference, often have increased amplitude values, but at the same time are not distinguished on the time logs. Clay or gypsum infilling is expressed as low amplitude anomalies. If it is partially washed out of the joints during drilling, the wave traveltime increases, which is reflected by the appearance of anomalies in the corresponding log.
The frictional properties of joints and primarily their wall roughness can be determined from amplitude images [18, 19]. At the same time, they can be determined most accurately and reliably for smooth, slightly rough, and roughly rough joints [17, 20] (Fig. 3, b). In order to validate the frictional properties of joints and their further subdivision, structural core logging was used [21]. In addition to roughness, it is used to determine the types and thickness of mineral infilling, which are difficult to establish reliably through hole logging.
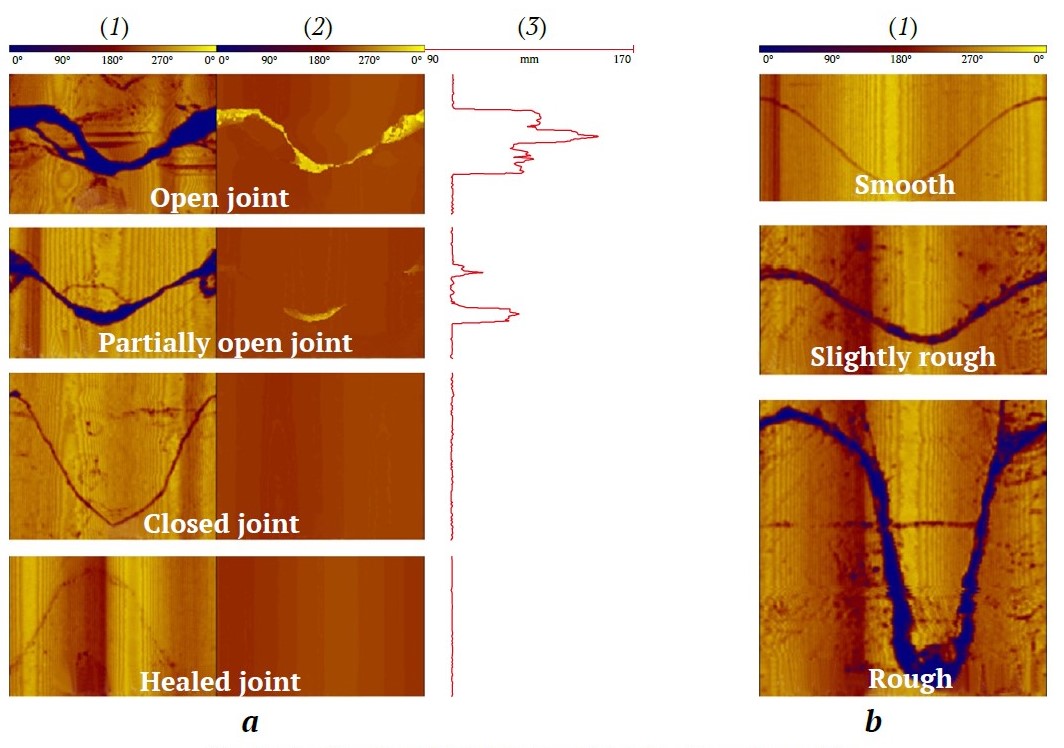
Fig. 3. Classification of joints by type (a) and wall roughness (b):
1 – display of the hole wall expressed in the amplitude of the acoustic wave (yellow color – high values, blue - low values); 2 – display of the hole wall expressed in the wave traveltime (yellow color – high values, blue - low values);
3 – log of the acoustic caliper
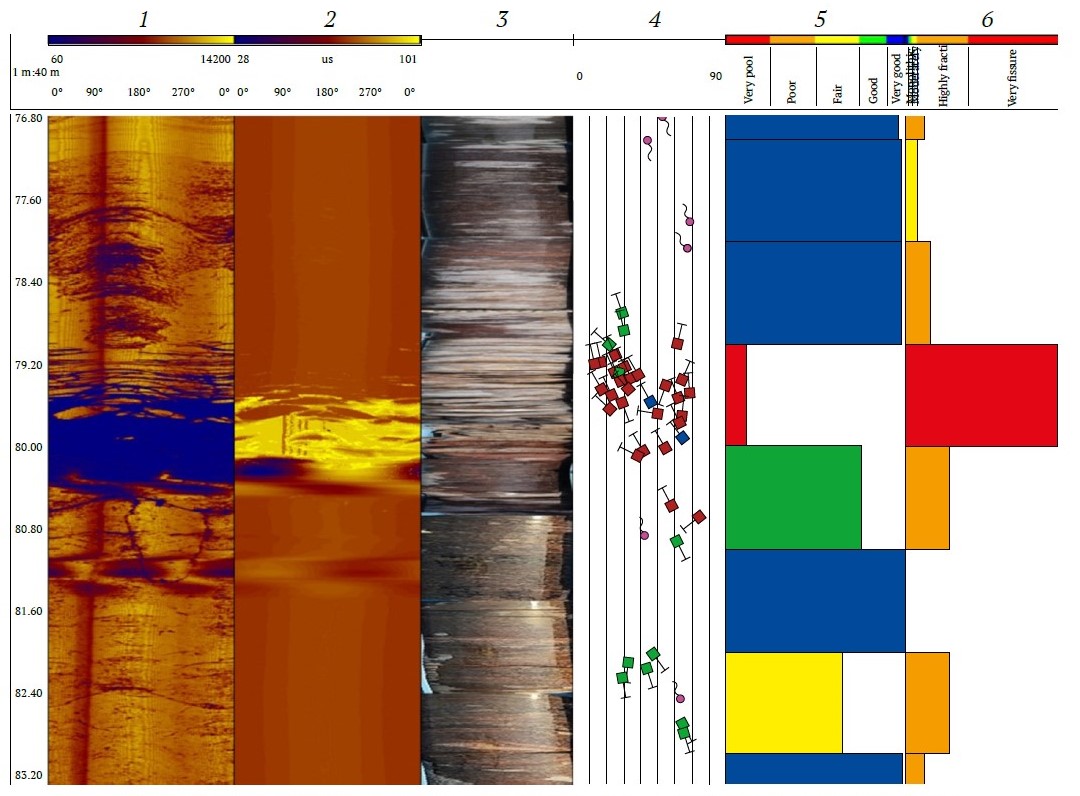
Fig. 4. Calculation of quantitative parameters of structural disturbance of the mass:
1 – hole wall mapping expressed in acoustic wave amplitude (yellow – high values, blue – low values); 2 – hole wall mapping expressed in wave traveltime (yellow – high values, blue – low values); 3 – core photo;
4 – “tadpole” joint plot; 5 – joint frequency per linear meter; 6 – RQD. Vertical scale 1 : 40
Numerical assessment of the degree of a rock mass disturbance by joint was carried out by determining the RQD parameter and the number of joints per linear meter of an investigated hole. For this purpose, the WellCAD program software has appropriate modules that use the joint data (depth, dip and strike) extracted in the process of log interpretation for calculation (Fig. 4).
1 https://www.alt.lu/products-wellcad/
Findings
The rock mass of the studied deposit consists of three lithologic domains of the first order – the host terrigenous-carbonate sediments and the diatreme kimberlite bodies themselves. Within the distinguished large units, the evaluation of rating parameters from hole data was performed for individual geotechnical intervals representing sections of a rock mass with continuous lithology, physical and mechanical properties, and structural features. As a rule, lithology and structural features are confidently determined during geotechnical core logging, but the distinguishing intervals of similar physical and mechanical properties of rocks is often a problem, because even within the boundaries of one lithology there can be a wide variation of strength properties. To solve the problem, this research utilizes the property of rocks to reflect acoustic waves. The extent of this reflection is directly related to the physical properties and condition of a hole surface. A smooth wall formed in compact rocks reflects more energy and thus has a higher amplitude than a rough wall. The reflectivity of walls formed in hard and / or monolithic rock is higher than those intersected in soft or intensely jointed rock. The rocks with a large proportion of clay component are characterized by the smallest amplitudes due to energy absorption. The same applies to joints, especially open joints or joints with soft infilling. In the amplitude logs they are shown in blue shades according to the adopted color scheme (see Fig. 3). An example of selecting intervals based on the amplitude of an acoustic wave is shown in Fig. 5.
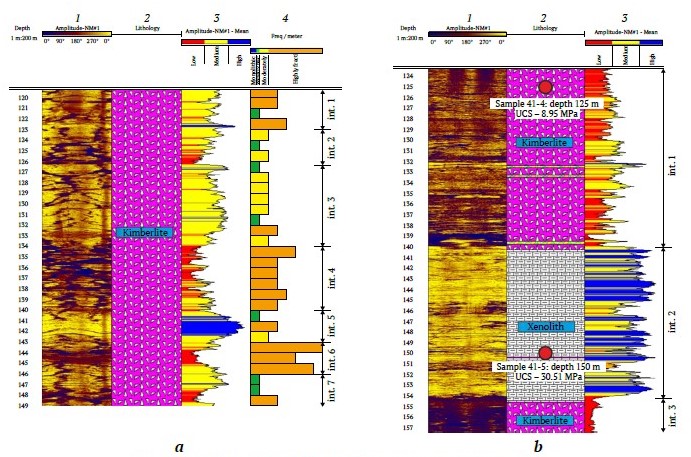
Fig. 5. Example of geotechnical intervals selection by acoustic wave amplitude:
1 – mapping of hole wall expressed in acoustic wave amplitude (yellow color – high values, blue – low values); 2 – lithology column;
3 – averaged acoustic wave amplitude calculated for one turn of the transmitter; 4 – joint frequency per linear meter.
Vertical scale 1 : 200
Fig. 5, a presents a fairly clear dependence of the wave amplitude (columns 1 and 3) on the degree of joint disturbance of the rock mass, expressed through the number of joints per linear meter of a hole (column 4). The most structurally disturbed areas with high values of joint frequency index (intervals 4 and 6) are characterized by low amplitude values. Fig. 5, b, in contrast, shows a relatively monolithic, virtually joint-free fragment. In the 140–154 m interval, the acoustic wave amplitude (columns 1 and 3) clearly shows an area with significantly higher values, which corresponds to the sedimentary rock xenolith in the matrix rock mass of the kimberlite breccia recorded by the results of geological logging of the hole core (column 2). At 125 and 150 m, samples were collected from kimberlite and xenolith showing uniaxial compressive strength (UCS) values of 8.95 and 30.51 MPa, respectively, indicating that there is a relationship between rock strength properties and acoustic wave amplitude, which was revealed in a number of studies [22, 23].
A total of 4,636 geotechnical intervals were identified for 73 holes. The length of an interval ranges from one meter for areas with complicated structures to six meters for those with relatively simple structures. The results of estimation of each input parameter separately for the selected lithologic domains are presented in the form of histograms in Figs. 6 и 7.
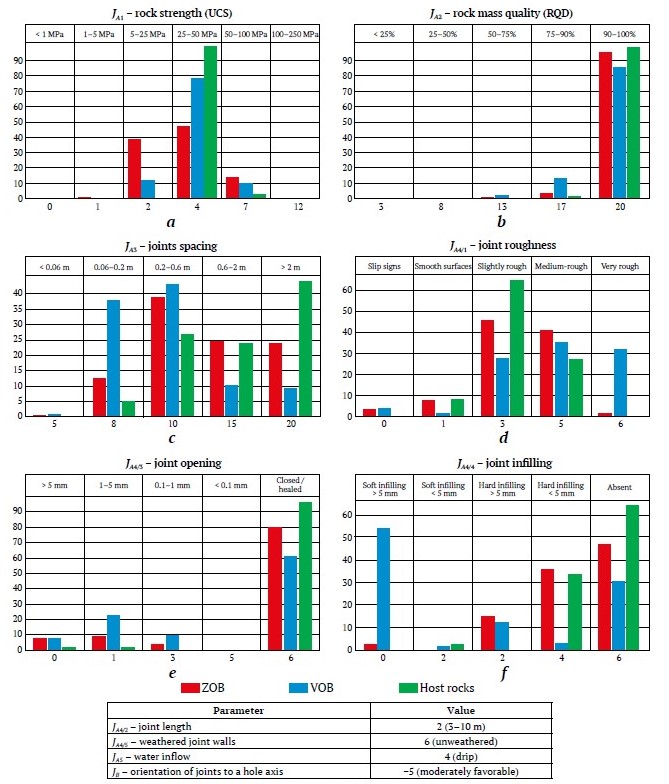
Fig. 6. Histograms of distribution of input parameters for RMR rating calculation
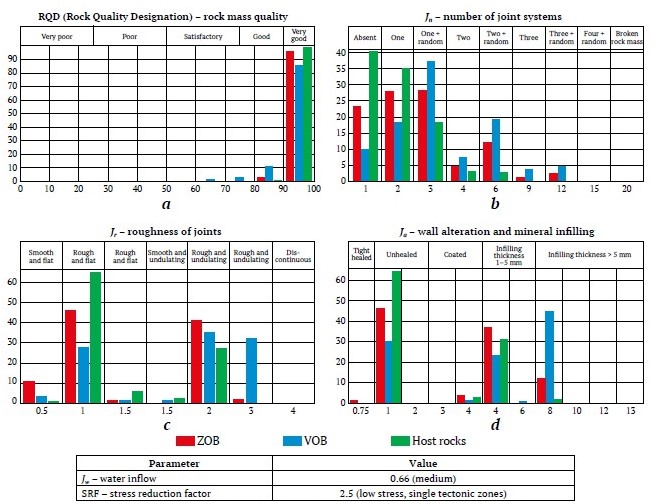
Fig. 7. Histograms of distribution of input parameters for calculating Q rating
For the rocks hosting the pipe, uniaxial compressive strength ranges 28.14–71.73 MPa with a mean value of 41.05 MPa (Fig. 6, a). The highest degree of variability in strength properties is characteristic of kimberlite breccia of the ZOB and VOB (including porphyritic kimberlite and autolithic breccia). The measured strength values range 2.15 to 119.48 MPa with a mean value of 32.54 MPa. The large variation of the uniaxial compression strength values of kimberlites is explained by the fact that their physico-mechanical and strength properties depend on their mineralogical and chemical composition and particle size distribution. These characteristics vary considerably among the kimberlites, both in area and depth. In addition, the kimberlites are subject to hypergene alteration, which leads to changes in their mineral composition and, consequently, to variations in strength characteristics [24]. In general, the obtained values of strength characteristics correspond to rock of low, moderate, medium, and high strength according to the existing classification [25]. At the same time, the overwhelming volume of the ore bodies is occupied by kimberlites of low and moderate strength.
RQD values vary widely, from 50 up to 100% (Fig. 6, b, Fig. 7, a), with average values with low coefficient of variation exceeding 90%, which corresponds to very good quality of rock masses for all lithologies [26]. It should be noted that the final RQD value is significantly affected by the quality of drilling, the orientation of a hole with respect to joints, and differences in joint spacing. For example, RQD = 0 when joint spacing is 100 mm or less, while RQD = 100 when the spacing is 110 mm or more. Another disadvantage is that RQD does not provide information on core fragments <10 cm, i.e., no weight is given to whether rejected fragments up to 10 cm in length are loose or compact (hard) rock.
Joint spacing was defined as the inverse of the joint modulus (number of joints per unit length (linear meter)). For correct estimation of this parameter, the orientation of a hole with respect to the joints in the rock mass is important, as demonstrated in Fig. 8, which shows three logged intervals disturbed by joints with the same distance between them equal to 0.1 m.
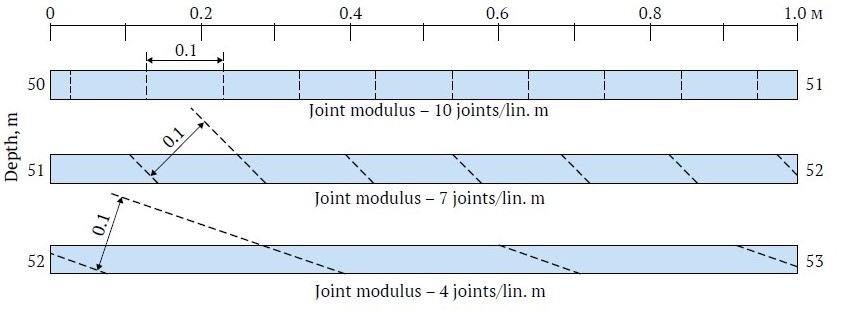
Fig. 8. Example of joint modulus calculation based on a hole core logging data (depth increases from left to right)
In the first interval (50–51 m), within which joints are located perpendicular to the core axis, joint modulus is equal to 10 joints/lin. m. For the second interval (51–52 m) with joints located at an angle of 45° to the axis, a modulus equal to 7 joints/lin. m was obtained. Finally, for the third interval (52–53 m) with an angle between the core axis and the joints of 20°, the modulus is 4 joints/lin. m. The true joint modulus was obtained only for the first interval, while for the other two intervals the modulus proved to be underestimated. In this case, the example considers only one joint system, while in a real rock mass, as a rule, two or more systems and several random (unsystematic) joints are developed, which affect the final value of the modulus. That is why, Terzaghi weighting was used in the calculation of this parameter [27]. It proportionally increases the “weight” of joints in a sample set (weighted average of each joint in a set) that are located at an angle other than right angle to a hole axis. The more acute the angle between a joint and a hole axis, the greater the value of the Terzaghi coefficient.
The rock mass of sediments hosting the pipe can be classified as practically monolithic (jointing class I according to SNIP II-94–80) with the average joint spacing more than 1.5 m (Fig. 6, c). For the rock masses of kimberlite bodies, there is almost a threefold excess of the joint frequency index in the VOB rock mass, indicating that it is significantly more disturbed. This confirms earlier conclusions based on the results of structural logging of the mine workings walls [28]. The kimberlites are medium-jointed rocks (class III, 0.5–1 m joint spacing), while the VOB kimberlites are highly jointed (class IV, 0.1–0.5 m joint spacing).
Lower values of joint frequency are observed for halogenic deposits, which are explained by their rheological properties, namely increased plasticity, which compensates for the applied tectonic and lithostatic loads. The xenoliths within kimberlite bodies are characterized by higher jointing than the host rock strata. In all likelihood, this is due to the processes of additional disturbance during the intrusion of kimberlite melt.
Estimating the true extent of joints is a very nontrivial task, especially from hole data, due to their three-dimensional nature, limited manifestation, and high variability of parameters. This parameter can be most accurately obtained by visual tracing of disturbances along the walls of outcrops or mine workings. However, the size of mine workings is often smaller than the extent of joints/faults, making it impossible to accurately determine their length. Statistical analysis of joint measurements performed within the underground mine workings [28] showed that joints up to three meters long predominate in the rock mass. It should be noted that this figure is largely approximate, as the estimate of the extent of larger joints and local faults is limited by the cross-section of mine workings (about 5 m). Taking into account the data obtained during structural studies in the Udachny open pit, the average joint length is assumed to be 3–10 m as a design average.
Based on the results of core logging, it was found that in the rock masses of both host sediments and kimberlite bodies rough joints of flat, undulating, and stepped configurations significantly dominate (see Fig. 6, d, Fig. 7). Moreover, joints in the kimberlite are more often characterized by greater roughness than joints in the sedimentary rocks. Roughness of joints without infilling increases the friction angle across them and hence increases the shear resistance in the plane of the defect. Also within the rock mass and especially in the endo / exocontact zone, joints with slickensides were noted. The presence of displacement signs on the joint planes, such as slickensides and slip grooves, having dip along the dip of the joint planes significantly reduces the shear resistance.
At low degrees of roughness, the greatest influence on joint shear strength is exerted by the strength properties of the mineral infilling. Most of the joints in the kimberlite of the Zapadny ore body and the host sediments have no mineral infilling (see Fig. 6, e). The main joint infilling is carbonates with subordinate importance of sulfates and halogenic rocks. Joints with sulphide manifestations are significantly more common in ZOB, while in VOB a rather large number of joints demonstrates ferruginization of the walls. The main joint infilling in the kimberlite joints of the Vostochny ore body is rock salt. For the host rocks, salt-filled joints are not widespread, although a quarter of all joints recorded in the argillaceous limestone at the contact with the VOB are saltfilled. Clay and quartz are also noted in single joints. The latter is more often found in the form of druses and vuggs and is associated with the hydrothermal stage of kimberlite alteration [29]. The vast majority of the filled joints are 1 to 5 mm thick, less frequently 5 to 10 mm thick. The greatest thickness is characteristic of joints filled with salt and calcite.
Based on the results of the analysis of interval jointing diagrams, it was found that the studied rock mass is characterized by the prevalence of one, less often two joint systems complicated by single unsystematic (random) joints (see Fig. 7, b). This is due to low tectonic activity in the deposit location area (central part of the Siberian Platform) and the absence of large high-rank faults. The largest number of joint systems is recorded in the exo-endocontact zone, which demonstrates increased disturbance due to thermodynamic effects from the intrusion of several portions of kimberlite melt.
The main source of water inflow to the deposit is the Middle Cambrian Aquifer Complex (MCAC) with two aquifers with enhanced filtration properties [12]. The MCAC groundwater is highly mineralized, gas-saturated, confined to limestone-dolomite sediments of the Middle-Lower Cambrian [30]. The values of formation pressures vary from 4.5 to 15.6 MPa, and the water inflows range from 0.6 to 228 l/min, which suggests medium level of water inflow into underground mine workings at deep levels of the mine. Consequently, the parameter JA5 from the RMR system is assumed to be 4, which corresponds to drip, and the parameter Jw of the Q system is assumed to be 0.66 – the water inflow level is medium.
The data on the stresses acting in the rock mass, which can be used to estimate the SRF factor in the calculation of the Q rating, are obtained from the results of investigations by the method of measuring hydraulic fracturing. In terms of effective stresses, the rock mass can be conditionally categorized as class B (strong rocks with stress (pressure) problems)2. In this case, the SRF factor is estimated by the ratio σc/σ1, where σc is the uniaxial compressive strength; σ1 is the maximum stress (Table 1).
Table 1
Estimation of SRF (stress reduction factor)
| Level | Rocks | σ1, MPa | σc, MPa | σc / σ1 | SRF |
| −465 | Kimberlite (ZOB) | 22.75 | 2.15–119.48 | 0.09–5.25 | 0.5–400 |
| −465 | Kimberlite (VOB) | 20* | 3.89–98.11 | 0.19–4.9 | 5–400 |
| −480 | Host rocks | 26.8 | 27.9–71.3 | 1.04–2.66 | 50–400 |
| −580 | Host rocks | 31.35 | 27.9–71.3 | 0.89–2.27 | 50–400 |
| * no in-situ measurements of stress in VOB were performed | |||||
The obtained high SRF values indicate potentially rockburst hazardous conditions of the deposit development in the studied depth interval. At the same time, according to the mine's geological service specialists, no dynamic manifestations of rock pressure (“crackle” in the rock mass, intensive roof breaks, “flaking” of rocks on the contour and in pillars, rock bursts) were observed during driving development workings at −480, −580 (−630) levels. Analysis of photologging of geotechnical hole cores showed the absence of large volumes of core disking, which is characteristic of brittle-elastic rocks under high-stress conditions, which also indicates a low potential for rockburst hazard of the rock mass at the investigated depths. The contradiction between the calculated data and the behavior of the rock mass in practice can be explained by the fact that as the necessary conditions for the rockburst manifestations, in addition to exceeding the compressive strength of rocks by the acting loads, it is required the rate of loading of rocks to exceed the rate of development of plastic or elastic-viscous deformations [31]. In absence of direct data confirming the presence of high stresses in the rock mass, a SRF value of 2.5 was adopted as a design value.
2 Using the Q-system. Rock mass classification and support design. NGI. 2015. 56 p.
Findings Discussion
Application of the approach described above to the collection and analysis of mining and geological information on the studied deposit allowed to calculate RMR and Q ratings and on their basis to perform categorization of the rock mass condition (Fig. 9).
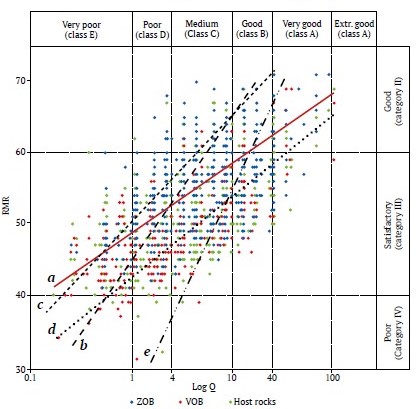
Fig. 9. Scatter diagram of RMR and Q rating scores: a – this study results, b – [2], c – [32], d – [33], e – [34]
According to the classification of Bieniawski [2] the considered lithologic domains include areas of poor, satisfactory, and good condition, which corresponds to IV, III, and II categories of rock masses in terms of stability. According to the averaged values, the ZOB and VOB kimberlites belong to the third category, while the host sediments have a intermediate value between the second and third categories. The average stable condition time ranges from 6 months (for spans up to 8 m) to 10 hours (for spans up to 2.5 m).
The Q rating is characterized by a range of values from 0.18 to 105.6. This variation in minimum and maximum values is due to the fact that the Barton’s classification uses a logarithmic scale with a spread of 106. Based on median values, the VOB kimberlites refer to class D with poor rock mass condition. Most of the ZOB rock masses can be categorized as Class C with a medium condition. The rocks that host the pipe predominantly fall into Class C with a medium rock mass condition.
The obtained estimated values of rating parameters are preliminary and rather conservative, requiring validation in the course of mining operations. This is due to the fact that the collection of geological and geotechnical information necessary for the calculation in the required volume and with the required level of data reliability is associated with numerous limitations. Thus, some of the input components for calculating the ratings were estimated from indirect data and assumed to be constants for the whole rock mass. This concerns the length of joints, water content of rock mass at the design depths, orientation of joints in relation to the design workings, and stresses acting in the rock mass. In the absence of the possibility of accurate estimation of missing parameters, the use of two or more classification systems in the design of deposit development methods provides a more complete and comprehensive picture of the geotechnical conditions of a rock mass and potential risks in its development, as the authors of the rating systems themselves say [2, 35].
Although there are many similarities between the RMR and Q classification systems, the different “sensitivity” of the parameters used and their structure result in the fact that the same rock mass areas characterized by different classifications can have significant differences in the final values, as shown in the scatter correlation diagram (see Fig. 9). As can be seen, for Q = 1 RMR varies over a wide range from 32 to 62, and for a RMR value of 50, the Q rating varies from 0.5 to 45. This moderate correlation is due to several reasons. The Q rating does not directly take into account the strength characteristic of rocks. Although an attempt was made in [36] to introduce uniaxial compression strength into the scheme for calculating the Qc rating, this correction was not widely used. The RMR system does not take into account overstress conditions (rockbursts) and is designed for applications with stresses up to 25 MPa, while for the Q system the active stresses in the rock mass are determined by the ratio of Jw and SRF values. Besides, the Q and RMR systems characterize fault zones differently. In the RMR system, no special parameter is used, while in the Q system the influence of faults is taken into account indirectly through the SRF parameter. In addition, the correlation depends on the type and structure of a rock mass, as demonstrated in numerous works [2, 32–34]. Some of the correlation curves are shown in Fig. 9. Since the rock mass under consideration is a combined rock mass, i.e., consisting of a layered and a non-layered components, the influence of the rock mass structure will be high.
The RMR and Q systems work best in a blocky rock mass, so its degree of disturbance, expressed through the RQD, or joint spacing, is often the most important input parameter on which the resulting value of both ratings depends. Given the previously mentioned shortcomings of the RQD parameter as a measure of structural disturbance of a rock mass, the potential error that this parameter introduces into the resulting ratings should be taken into account and evaluated.
Despite the above-mentioned discrepancies, each of the systems allows to characterize the geotechnical condition of a rock mass, to determine the category of a rock mass in terms of stability, the time of stable conditions, the type of driving and the system of working support. The choice of the basic classification system should be made based on the tasks to be solved and the set of input data. In practice, the Q system using the nomogram developed by the Norwegian Geotechnical Institute (Fig. 10) is more popular in the selection of systems of underground mine support.
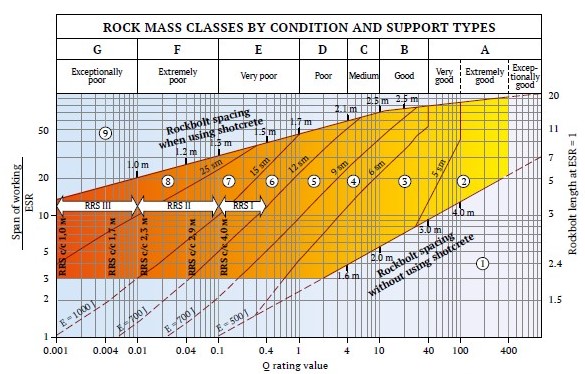
Fig. 10. Nomogram for selection of workings support parameters based on Q rating
Source: Using the Q-system. Rock mass classification and support design. NGI. 2015. 56 p.
Evaluation of the optimum characteristics of the support is carried out with the use of additional parameters: “equivalent dimension” (ED) and “Excavation Support Ratio” ESR [3]. For the Udachny mine, two options of mine workings (excavations) were considered: permanent workings with ESR equal to 1.6, as well as face-ends for which ESR is equal to 1. The span of excavations was taken as 5 m, hence the span / ESR ratio (vertical scale on the left in Fig. 10) for permanent excavations is 3.1, for face-ends, 5. Due to the obtained range of Q rating values in the nomogram (Fig. 10), the following support recommendations were proposed. Four types of support were recommended for permanent excavations. Local (scattered) support with reinforced concrete rockbolts of 2 m long with rockbolt spacing of 1–4 m for areas with very strong, strong, and medium rock mass according to the stability categories (classes A, B, and C). Systematic rock bolting with similar rockbolt parameters in combination with disperse-reinforced shotcrete 5–6 cm thick for D class rocks. For areas of very weak rocks (fault zones, areas of contact alteration) it is recommended to reduce the distance between rockbolts with a simultaneous increasing thickness of the layer of shotcrete to 9–12 cm. For mine workings face-ends, similar parameters of support are defined depending on the category of a rock mass, but it is recommended to increase the length of rockbolts up to 2.5 m, as well as a sequential decrease in the rockbolt spacing and increasing the thickness of shotcrete layer as the category of stability of a rock mass declines.
Conclusion
The application of a comprehensive data collection system including acoustic televiewer hole logging and geological and structural logging of non-oriented core, as well as the use of the results of laboratory studies of physical and mechanical properties of rocks, in-situ measurements of stress-strain state and water inflow allowed to calculate the rating parameters of rock mass condition according to RMR and Q classification systems for the deep levels of the Udachny underground mine. Based on them, the ore bodies and host sediments rock masses were assessed for stability (classes/categories were assigned), and the optimal method and parameters of mine workings support were determined. A database of geotechnical data has been accumulated, which can be used to calculate other ratings such as MRMR [5], RMi [37], GSI [7], etc., without transient equations, if necessary.
It should be noted that the calculation of the ratings is an iterative procedure that is repeated as new data becomes available and lasts for the entire period of a mine’s operation, and the studies obtained at the current stage require updating in the course of mining.
Rating classifications are an important tool for assessing a rock mass condition and are largely used as a means of short-term prediction of its behavior. The empirical basis of rating systems introduces a limitation to their use as key data sources in engineering decision making, especially in complicated mining and geologic environments. Integration of the ratings with analytical and numerical simulation methods looks like the most promising approach to account for the uncertainty and variability of rock mass properties in the design and operation of underground mines.
References
1. Bieniawski Z. T. Engineering classification of jointed rock masses. Civil Engineer in South Africa. 1973;15(12):335–344.
2. Bieniawski Z. T. Engineering rock mass classifications. New York: Wiley;1989. 251 p.
3. Barton N., Lien R., Lunde J. Engineering classification of rock masses for the design of rock support. Rock Mechanics. 1974;6:189–236. https://doi.org/10.1007/BF01239496
4. Barton N. Some new Q-value correlations to assist in site characterization and tunnel design. International Journal of Rock Mechanics and Mining Sciences. 2002;39:185–216.
5. Laubscher D. H. G eomechanics classification system for the rating of rock mass in mine design. Journal of the Southern African Institute of Mining and Metallurgy. 1990;90(10):257–273. https://doi.org/10.1016/0148-9062(91)90830-F
6. Laubscher D. H., Jakubec J. The MRMR Rock mass classification for jointed rock masses. In: Hustrulid W. A., Bullock R. L. (Eds.) Underground Mining Methods: Engineering Fundamentals and International Case Histories. Littleton, Colorado: SME; 2001. Pp. 475–481.
7. Hoek E. Strength of rock and rock masses. ISRM News Journal. 1994;2(2):4–16.
8. Hoek E., Brown E. T. The Hoek–Brown failure criterion and GSI – 2018 edition. Journal of Rock Mechanics and Geotechnical Engineering. 2019;11(3):445–463. https://doi.org/10.1016/j.jrmge.2018.08.001
9. Gwynn X., Brown M. C., Mohr P. J. Combined use of traditional core logging and televiewer imaging for practical geotechnical data collection. In: Dight P. M. (ed.) Slope Stability 2013: Proceedings of the 2013 International Symposium on Slope Stability in Open Pit Mining and Civil Engineering. Perth: Australian Centre for Geomechanics; 2013. Pp. 261–272. https://doi.org/10.36487/ACG_rep/1308_13_Mohr
10. Serebriakov E. V., Gladkov A. S., Gapfarov T. D. Modern methods of data collection for structural damage assessment in rock mass: Review. Mining Informational and Analytical Bulletin. 2023;(9):160–177. (In Russ.) https://doi.org/10.25018/0236_1493_2023_9_0_160
11. Kostrovitsky S. I., Spezicius Z. V., Yakovlev D. A. et al. Atlas of primary diamond deposits of the Yakutsk kimberlite province. Mirny: MGT LLC Publ.; 2015. 480 p. (In Russ.)
12. Kolganov V. F., Akishev A. N., Drozdov A. V. Mining and geologic features of primary diamond deposits of Yakutia. Mirny: ALROSA, Yakutniproalmaz Institute Publ.; 2013. 568 p. (In Russ.)
13. Kopylova M. G., Kostrovitsky S. I., Egorov K. N. Salts in southern Yakutian kimberlites and the problem of primary alkali kimberlite melts. Earth-Science Reviews. 2013;119:1–16. https://doi.org/10.1016/j.earscirev.2013.01.007
14. Celada B., Tardáguila I., Varona P. et al. Innovating tunnel design by an improved experience-based RMR system. In: Proceedings of the World Tunnel Congress 2014 – Tunnels for a Better Life. Foz do Iguaçu, Brazil, 9–15 May 2014. PP. 1–9.
15. Peyras L., Rivard P., Breul P. et al. Characterization of rock discontinuity openings using acoustic wave amplitude – Application to a metamorphic rock mass. Engineering Geology. 2015;193:402–411. https://doi.org/10.1016/j.enggeo.2015.05.014
16. McKenna G. T. C., Roberts-Kelly S. L. Televiewer imaging of boreholes; benefits and considerations for interpretation in the absence of physical rock core. In: Lehane B., Acosta-Martinez H. E., Kelly R. (Eds.) Geotechnical and Geophysical Site Characterisation, ISC’5. Sydney, Australia: Australian Geomechanics Society; 2016. Pp. 291–296.
17. Serebriakov E. V., Gladkov A. S. Application of acoustic televiewer in the assessment of structural disturbance and geomechanical state of the rock mass. In: Engineering and Ore Geophysics 2023. Collection of papers of the 19 th scientific and practical conference and exhibition. Moscow: EAGE GEOMODEL LLC; 2023. Pp. 329–333. (In Russ.)
18. Bae D. S., Kim K., Koh Y., Kim J. Characterization of joint roughness in granite by applying the scan circle technique to images from a borehole televiewer. Rock Mechanics and Rock Engineering. 2011;44:497–504. https://doi.org/10.1007/s00603-011-0134-9
19. Thomas R. D. H., King A. M., Neilsen J. M. Assessing waviness from televiewer for incorporation within defect plane shear strength models. In: Proceedings of the 48-th US Rock Mechanics / Geomechanics Symposium. 1–4 June 2014, Minneapolis, Minnesota.
20. Barton N., Choubey V. The shear strength of rock joints in theory and practice. Rock Mechanics. 1977;10:1–54. https://doi.org/10.1007/BF01261801
21. Fredrick F. D., Nguyen T., Seymour C., Dempers G. Geotechnical data from optical and acoustic televiewer surveys. The AusIMM Bulletin. 2014:62–66.
22. Katic N., Chalmas R., Christensen H. F. OATV for strength estimations in Copenhagen Limestone. In: Proceedings of the 17 th Nordic Geotechnical Meeting Challenges in Nordic Geotechnic. 2016. Pp. 169–176.
23. Kao H.-Ch., Chou P.-Y., Lo H.-Ch. An innovative application of borehole acoustic image and amplitude logs for geotechnical site investigation. Acta Geophysica. 2020;68(6):1821–1832. https://doi.org/10.1007/s11600-020-00493-2
24. Podgaetskiy A. V. The influence of the mineralogical compound on the formation of physical and mechanical properties of kimberlites. Mining Informational and analytical bulletin. 2011;(8):105–110. (In Russ.)
25. Palmstrom A. Measurement and characterization of rock mass jointing. In: Sharma V. M., Saxena K. R. In-situ Characterization of Rocks. A. A. Balkema Publishers; 2001.
26. Deere D. U. Rock quality designation (RQD) after twenty years. U.S. Army Corps of Engineers Vicksburg, MS: Waterways Experimental Station; 1989. 93 p.
27. Terzaghi R. Sources of error in joint surveys. Géotechnique. 1965;15(3):287–304. https://doi.org/10.1680/geot.1965.15.3.287
28. Serebryakov E. V., Gladkov A. S. Geological and structural characteristics of deep-level rock mass of the Udachnaya pipe deposit. Journal of Mining Institute. 2021;250:512–525. https://doi.org/10.31897/PMI.2021.4.4
29. Filippov A. G. Hydrothermal quartz from kimberlites of Yakutia. Geologiia i Geofizika. 1992;(11):108–115. (In Russ.)
30. Alekseev S. V., Alekseeva L. P., Gladkov A. S. et al. Brines in deep horizons of the Udachnaya kimberlite pipe. Geodynamics & Tectonophysics. 2018;9(4):1235–1253. (In Russ.) https://doi.org/10.5800/GT-2018-9-4-0393
31. Petukhov I. M. Rock bursts at coal mines. 2 nd revised and enlarged edition. St. Petersburg: FGUP “State Research Institute of Mining Geotechnics and Mine Surveying – MSC VNIMI” Publ.; 2004. 238 p. (In Russ.)
32. Barton N. The influence of joint properties in modelling jointed rock masses. In: 8 th ISRM Congress. September 25–29, 1995. International Society for Rock Mechanics and Rock Engineering. Pp. 1023–1032.
33. Sayeed I., Khanna R., Empirical correlation between RMR and Q systems of rock mass classification derived from Lesser Himalayan and Central crystalline rocks. In: International Conference on «Engineering Geology in New Millennium». New Delhi, 27–29 October, 2015. Pp. 1–12.
34. Sadeghi S., Sharifi Teshnizi E., Ghoreishi B. Correlations between various rock mass classification/characterization systems for the Zagros tunnel-W Iran. Journal of Mountain Science. 2020;17(1):1790–1806. https://doi.org/10.1007/s11629-019-5665-7
35. Barton N., Bieniawski Z. T. RMR and Q-Setting records. Tunnels and Tunnelling International. 2008:26–29.
36. Barton N. Some new Q-value correlations to assist in site characterisation and tunnel design. International Journal of Rock Mechanics and Mining Sciences. 2002;39(2):185–216. https://doi.org/10.1016/S1365-1609(02)00011-4
37. Palmstrom A. Characterizing rock masses by the RMi for use in practical rock engineering: Part 1: The development of the Rock Mass index (RMi). Tunnelling and Underground Space Technology. 1996;11(2):175–188.
About the Authors
E. V. SerebryakovRussian Federation
Evgeny V. Serebryakov – Cand. Sci. (Geol. and Mineral.), Researcher at the Laboratory of Engineering Geology and Geoecology
Irkutsk
I. A. Zaytsev
Russian Federation
Ilya A. Zaytsev – Chief Geologist
Mirny
A. A. Potaka
Russian Federation
Andrey A. Potaka – Head of the Geotechnical Monitoring Department
Mirny
Review
For citations:
Serebryakov E.V., Zaytsev I.A., Potaka A.A. Assessment of rating parameters of the rock mass conditions at Udachny underground mine deep levels. Mining Science and Technology (Russia). 2024;9(3):206-220. https://doi.org/10.17073/2500-0632-2023-12-192


