Scroll to:
Fracture toughness of rock-concrete interfaces and its prediction based on acoustic properties
https://doi.org/10.17073/2500-0632-2024-10-316
Abstract
The relevance of the subject is determined by the need to solve the problem of ensuring the safety and prevent failure of facilities containing an interface between rock and concrete. These include mine shafts, hydroelectric dams in mountainous areas, reinforced concrete tunnel supports and others that are subjected to both static loads from overlying rocks and soils and dynamic loads from explosions and earthquakes. We perfomed laboratory tests according to the International Society for Rock Mechanics (ISRM) methodology on specimens with interfaces between gypsum stone and sand-cement mortar. The fracture toughness coefficient KIC of the interfaces in the specimens was investigated. The cylindrical specimens were 40 mm in diameter and 150 mm long with a V-shaped notch in the middle part. The specimens bending strain measured using a three-point pattern allowed the KIC to be determined based on the maximum force at 5–6 cycles. The average KIC value for interface between rock and concrete proved much lower than that for rock and even for specimens made entirely of concrete. For the specimens without concrete, the average value was 1.327 MPa×√m, and for fully concrete specimens, 0.858 MPa×√m. The average value KIC for the specimens with concrete was 0.323 MPa×√m, which was 4 times lower than that for the specimens without concrete and 2.5 times lower than that for the concrete specimens. The formation of a calibrated fracture during testing results in a relative increase in the internal mechanical loss factor Q−1, determined by the resonance method, by up to 30%. This allows estimating KIC fracture toughness coefficients of rock-concrete interfaces using Q−1. The obtained results can be used in actual practice in the design, operation, and organization of nondestructive testing and monitoring of industrial mining facilities that include these interfaces.
Keywords
For citations:
Voznesenskii А.S., Ushakov E.I., Kutkin Ya.O. Fracture toughness of rock-concrete interfaces and its prediction based on acoustic properties. Mining Science and Technology (Russia). 2025;10(1):5-14. https://doi.org/10.17073/2500-0632-2024-10-316
Fracture toughness of rock-concrete interfaces and its prediction based on acoustic properties
Introduction
In current mining activities, the study subject is often the interface between rock and concrete taking place in many surface and underground structures such as mine shafts, hydroelectric dams in mountainous areas, reinforced concrete tunnel support and other similar facilities. One of the tasks in the construction and operation of such structures is to ensure their safety and prevent failure under the effect of both static loads from overlying rocks and soils and dynamic impacts. The sources of dynamic impacts are seismic waves from explosions [1] and earthquakes [2, 3]. The subject under consideration is an integral part of the solution of the above problem and requires experimental studies (testing) of the strength properties of the interface between rock and concrete.
The theoretical justification of the studies described below is based on the fundamental works of A. Griffiths [4]. Within this theory stress intensity factor K is considered [5]. Under tension, the stress intensity factor of the first strain mode , where σ is the effective stress, l is fracture length. The ability of a material to maintain its integrity is evaluated by the corresponding fracture toughness coefficient (FT) KIC, determined based on experimental data. It is a characteristic of a fractured material and characterizes the maximum length of a fracture at which no fracture germination occurs. The condition of absence of fracture growth and subsequent failure is described by the expression KI ≤ KIC.
Knowing the effective stresses σ, as well as FT in combination with the parameters of fractured rock masses and concrete supports will allow ensuring their safety in the design, construction, and operation of mining facilities under the conditions of static and dynamic loads.
FT is applicable to both separate materials such as metals, concrete, composites, and the interfaces between them. Many researchers have studied FT for metals and alloys [6, 7], including heterogeneous ones [8]. For composite materials, FT was investigated in [9, 10]. FT is also used in the evaluation of strength properties of concrete [11], including for special types of concrete such as fibre concrete [12]. FT was used for novel materials used for manufacturing articles at printers [13]. Far fewer publications are devoted to rock FT studies [14], especially concrete-rock interfaces [15].
Typically, experimental research techniques use three- or four-point bending loading schemes for specimens and rectangular beams [16, 17], half-disks [18], disk specimens [19], and cubes with a notch [20]. For rocks, the FT determination methodology recommended by the International Society of Rock Mechanics (ISRM) is used [21]. FT of interfaces between different rocks or minerals is also of interest in assessing the stability of rock masses. In [22, 23], the methodology and results of determining the fracture toughness coefficient with respect to the interfaces between different rock types was described, and the FT ranges for some their combinations were determined.
The purpose as well as the novelty of this paper consists in evaluating FT of the first strain mode KIC of the interfaces between different rock types and concrete. In addition, the acoustic properties of rock specimens were determined, and their relationship with KIC was evaluated. These properties included longitudinal and transverse elastic wave velocities, as well as internal mechanical loss factor Q−1 [24, 25] to evaluate the feasibility of predicting KIC based on the data of acoustic measurements.
The tasks addressed included:
- Justification of the testing technique for determining FT of rock-concrete interfaces;
- Determination of elastic wave propagation velocities by ultrasonic pulse scanning before and after a test to assess the effect of a forming fracture on the velocities;
- Determination of loss factor Q−1 and its changes during the formation of a reference fracture by the resonance method;
- ISRM bending testing of specimens to determine the KIC of rock-concrete interfaces;
- Processing and comparative analysis of the obtained results with determining the ranges of FT values for the interfaces between rocks of different types, as well as between rocks and concrete;
- Practical conclusions on the obtained FT values of the interfaces between rocks of different types and concrete to be taken into account in the design and operation of structural elements of mining systems at mining enterprises.
1. Research Materials and Techniques
For testing, cylinder specimens 40 mm in diameter and 150 mm long were produced, consisting of two equal parts: rocks from the Novomoskovsk gypsum deposit (Novomoskovsk, Tula region, Russia) [22, 23] and sand-cement mortar. A series of 19 such specimens was prepared and aged for four months until the mortar was fully cured (Fig. 1, a). In addition, four specimens were made entirely of sand-cement mortar (Fig. 1, b). V-shaped notches were cut in the specimens for the ISRM testing described below.
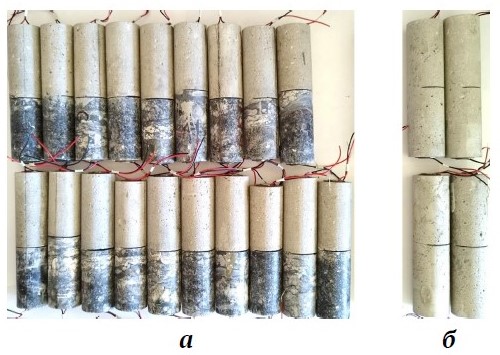
Fig. 1. Specimens with gypsum stone – cement stone interfaces (a) and cement stone specimens with notches (b)
The test specimens were labeled according to the original 150 mm long gypsum specimens, half of which were used to make concrete coated specimens C. They were labeled as:
- GGC gypsum stone;
- gypsum stone and GKC flintstone interfaces;
- KKC flintstone;
- gypsum-flintstone interface with veins of carbonaceous GUKC clays.
For example, GKC3-1 meant a specimen with an interface between concrete and half of the number 1 specimen made of gypsum and flintstone GK-3.
Tests on 150 mm long cylindrical specimens with notches were carried out according to the three-point scheme shown in Fig. 2, a. The notch was V-shaped, Fig. 2, b, and the angle θ was 90°.

Fig. 2. Schematic of a three-point test on a notched specimen (a) and cross-section of a notched specimen (b)
In the calculations, formula (1) from [21] was used to determine the fracture toughness coefficient:
KIC = AminPmax/D1.5, Amin = [1.835+7.15a0/D+9.85(a0/D)2]S/D, (1)
where KIC is fracture toughness coefficient, MPa×√m; Pmax is maximum bending force, kN; D is diameter of a chevron bending of specimen, cm; a0 is distance between the chevron indents and specimen surface, cm; S is distance between the support points, cm.
During the tests, an installation based on the ASIS complex (NPO Geotech LLC, Penza, Russia) was used. The specimens were tested using a three-point bending pattern. In addition to the system that set the cyclic motion of the frame, a second system was used to record the deflection force and magnitude. Two linear displacement transducers (LVDTs) with a measurement range of 10 mm recorded deflection directly on a specimen. These transducers were connected to the 18-bit ADC of the QMBox measuring system (R-Technology, Moscow, Russia).
The installation for determining internal mechanical losses included a JDS 2900 series signal generator with a DPA 1698 power amplifier, a GDS-71022 oscillograph with an external preamplifier, and a specimen holder. Piezoelectric transducers 1.2 mm thick were glued to the ends of a specimen to measure the acoustic losses using the resonance method.
Longitudinal P- and transverse S-wave velocities were measured using an ultrasonic instrument (Ecogeos Prom LLC, Tver, Russia). The velocities were determined based on the time taken by elastic pulses to travel through the specimens.
Cycle tests involved maximum frame displacements of 0.10, 0.15, 0.20, 0.25, 0.30, 0.35, 0.40 mm. The minimum displacement was 0.05 mm. The displacement speed was 0.2 mm/min.
Acoustic tests along the long axis of the specimens included the measurement of propagation velocities of longitudinal Vp and transverse Vs elastic waves in a rock using standard techniques. Internal mechanical losses were estimated based on the loss factor (or inverse Q-factor) Q−1. These estimates were carried out in addition to the mechanical tests two times, before and after a specimen was tested.
Experimental Q−1 measurements were performed through frequency scanning of the resonance characteristics of a specimen. The signal from the SFG-2110 harmonic oscillator was applied to an exciting piezoceramic plate 20.0 mm in diameter and 1.5 mm thick, which was mounted at one end of a specimen. From a second similar piezoelectric plate at the opposite end of the specimen, the signal was fed to a preamplifier with a bandwidth of 20-500 kHz and then to a GDS-71022 digital oscillograph. The Q−1 factor was calculated using the following formula:
Q−1 = Δf/f, (2)
where Δf is frequency bandwidth at 1/√2 of the maximum of the resonance curve; f0 is resonance frequency.
2. Testing results
2.1. KIC coefficient measurement results for rock-concrete specimens
Figs. 3–6 show, for example, the curves of the time dependencies of a specimen load P and deflection y, as well as the load P dependence of deflection y. The complete set of plots for all 19 specimens with rock-concrete contacts and four concrete specimens are available in the data.mendeley.com repository [26].
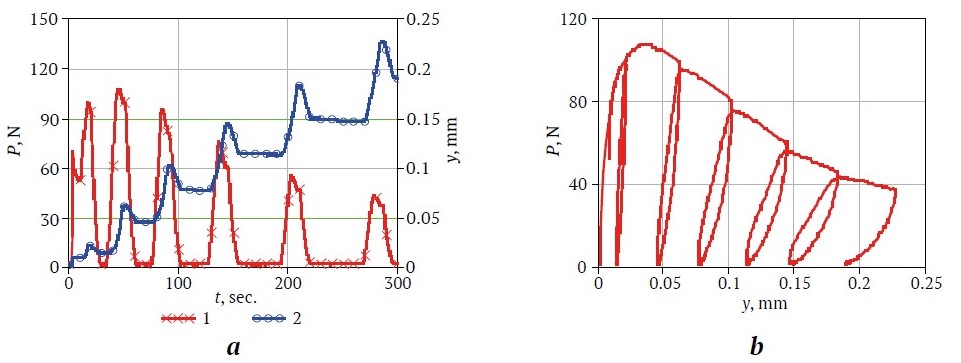
Fig. 3. Curves of time dependencies of load and deflection (a) load dependence of deflection (b) under cyclic loading of specimen GKC3-2
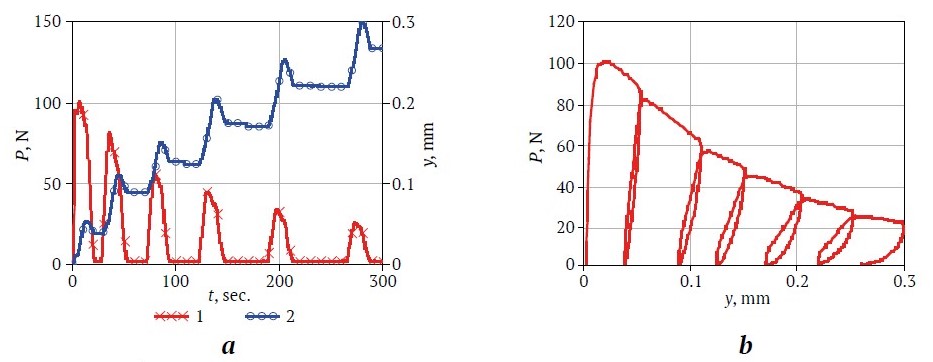
Fig. 4. Curves of time dependencies of load and deflection (a) and load dependence of deflection (b) under cyclic loading of specimen GKС5–1
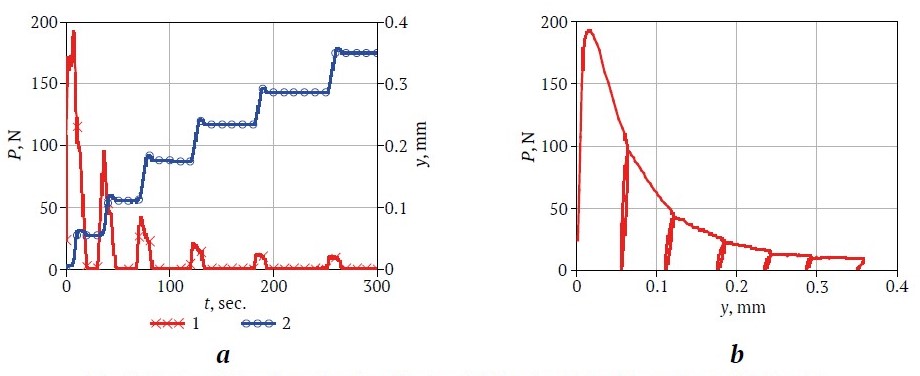
Fig. 5. Curves of time dependencies of load and deflection (a) and load dependence of deflection (b) under cyclic loading of specimen GKС5–2
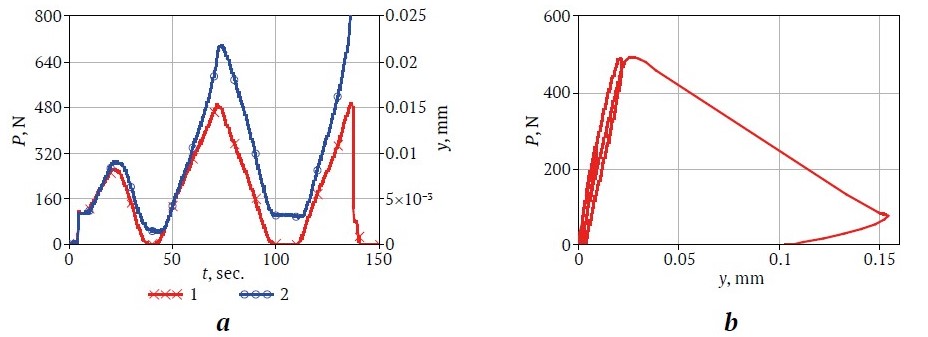
Fig. 6. Curves of time dependencies of load and deflection (a) and load dependence of deflection (b) under cyclic loading of specimen C1
2.2. Concrete specimens testing results
Fig. 6 shows similar test results for concrete specimens as an example.
2.3. Acoustic properties of specimens with rock-concrete interface
Tables 1 and 2 summarize the results of measuring KIC using formula (1) and the acoustic properties of rock-concrete specimens and concrete specimens before and after testing. The following designations are used in the tables:
Pmax is maximum load during cyclic loading of a specimen;
KIC is fracturing toughness coefficient of the first mode of strain;
Vp is velocity of longitudinal wave propagation;
Vs is velocity of transverse wave propagation;
f0 is specimen resonance frequency;
Q−1 is internal mechanical loss factor.
In Table 1, dashes indicate specimens broken up during testing.
After testing, no clear resonance could be obtained in the specimens due to the increased losses in the concrete that is indicated by dashes in Table 2.
For comparison, Table 3 presents the data from previous tests on specimens of rocks and their interfaces without concrete.
Table 1
Properties of specimens with rock-concrete interface
Specimen | Pmax, N | KIC, | Before test | After test | ||||||
Vp, m/s | Vs, m/s | f0, Hz | Q–1 ×10⁻³ | Vp, m/s | Vs, m/s | f0, Hz | Q–1 ×10⁻³ | |||
GGС2-1 | 216.30 | 0.395 | 4,019 | 2,538 | 22,848 | 5.26 | 3,942 | 2,515 | 8,992 | 15.63 |
GGС2-2 | 188.42 | 0.344 | 4,032 | 2,649 | 10,765 | 4.10 | 4,012 | 2,706 | 10,270 | 5.18 |
GGC3-1 | 154.66 | 0.282 | 3,831 | 2,418 | 10,205 | 3.43 | – | – | – | – |
GGC3-2 | 67.07 | 0.122 | 3,774 | 2,515 | 9,110 | 4.39 | – | – | – | – |
GKС1-1 | 229.03 | 0.418 | 4,125 | 2,953 | 10,402 | 6.06 | 4,044 | 2,917 | 10,102 | 4.27 |
GKC1-2 | 210.92 | 0.385 | 3,876 | 2,535 | 9,190 | 4.13 | 3,684 | 2,005 | 47,750 | 3.61 |
GKС2-2 | 292.63 | 0.534 | 4,136 | 2,665 | 11,374 | 4.67 | 4072 | 2,923 | 9,002 | 10.53 |
GKC3-1 | 262.79 | 0.480 | 3,831 | 2,502 | 9,925 | 2.72 | 3,684 | 1,857 | 48,910 | 4.29 |
GKC3-2 | 107.68 | 0.197 | 3,852 | 2,484 | 9,117 | 3.40 | – | – | – | – |
GKC5-1 | 100.35 | 0.183 | 3,780 | 2,500 | 9,360 | 5.65 | 3,549 | 1,919 | 50,900 | 2.77 |
GKC5-2 | 192.29 | 0.351 | 3,975 | 2,881 | 11,000 | 4.00 | – | – | – | – |
KKC2-1 | 238.32 | 0.435 | 3,937 | 3,337 | 9,620 | 6.67 | – | – | – | – |
KKC2-2 | 165.91 | 0.303 | 3,854 | 2,550 | 8,967 | 4.57 | 3,937 | 2,582 | 49,000 | 5.21 |
KKС3-1 | 139.00 | 0.254 | 3,872 | 2,841 | 10,402 | 6.33 | 3,633 | 2,477 | – | – |
KKС3-2 | 121.38 | 0.222 | 4,068 | 2,673 | 10,617 | 5.18 | 3,942 | 2,695 | – | – |
KKС5-1 | 167.38 | 0.306 | 4,010 | 2,574 | 11,240 | 4.18 | 3,989 | 2,929 | 10,342 | 7.75 |
KKС5-2 | 292.63 | 0.534 | 4,212 | 2,870 | 10,823 | 5.56 | 4,201 | 3,236 | 16,738 | 5.81 |
GUKC1-1 | 81.26 | 0.148 | 3,443 | 2,373 | 7,030 | 9.81 | – | – | – | – |
GUKC1-2 | 159.55 | 0.291 | 3,900 | 2,675 | 9,061 | 3.97 | – | – | – | – |
Average | 178.29 | 0.323 | 3,922 | 2,660 | 10,581 | 4.95 | 3,890 | 2,563 | 26,200 | 6.51 |
Table 2
Properties of concrete specimens
Specimen | Pmax, N | KIC, | Before test | After test | ||||||
Vp, m/s | Vs, m/s | f0, Hz | Q–1 ×10⁻³ | Vp, m/s | Vs, m/s | f0, Hz | Q–1 ×10⁻³ | |||
С1 | 492.3 | 0.899 | 3,571 | 2,540 | 22.6 | 7.29 | 3,120 | 2,100 | – | – |
С2 | 429.6 | 0.784 | 3,392 | 2,402 | 19.3 | 5.70 | 3242 | 1,920 | – | – |
S3* | 503.0 | 0.918 | 3,297 | 2,430 | 21.2 | 5.90 | 3,170 | 1616 | – | – |
С4 | 456.1 | 0.832 | 3,414 | 2,495 | 22.8 | 6.34 | 3,327 | 1,849 | – | – |
Average | 470.2 | 0.858 | 3,418 | 2,466 | 21.5 | 6.31 | 3,215 | 1,808 | – | – |
Table 3
KIC fracture toughness coefficients of rocks and contacts between them without concrete [22, 23]
Specimen | Pmax, N | KIC[ MPa×√m] |
GG-1 | 639 | 0.832 |
GG-2 | 985 | 0.995 |
GG-3 | 988 | 1.089 |
GG-4 | 817 | 0.901 |
UG-1 | 833 | 0.919 |
GUK-1 | 825 | 0.950 |
GUK-2 | 1,100 | 1.161 |
GUK-3 | 1,194 | 1.317 |
GK-3 | 1,147 | 1.495 |
GK-5 | 1,225 | 1.351 |
KK-1 | – | – |
KK-2 | 2,039 | 2.447 |
KK-3 | – | – |
KK-4 | 2,232 | 2.461 |
3. Findings Discussion
Let us analyze the shapes of the curves in Fig. 3–6, obtained when testing specimens in the conditions of specified cyclic bending strains with increasing maximum displacements in each subsequent cycle.
The peculiarities of plastic strain of the specimens deserve attention. They consisted in the increase of residual plastic strains after each strain cycle and manifested themselves in the form of a characteristic loop-shaped pattern of curves P(y) with a shift to the right of each subsequent loop. The plots clearly show an area of extreme strain where the maximum load decreased with increasing number of cycles. Coefficient KIC was calculated based on the highest maximum value Pmax. For clarity, all the results of the KIC testing are presented in the diagram in Fig. 7.
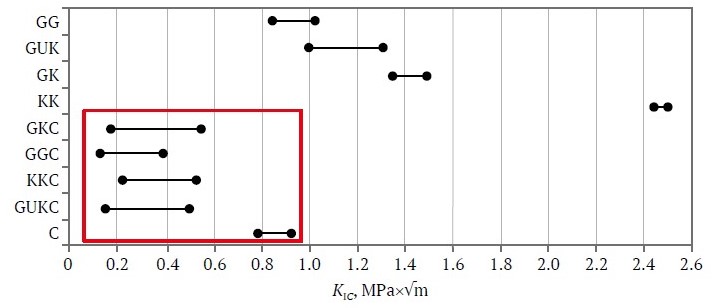
Fig. 7. Ranges of variation of KIC coefficient for rocks, rock-concrete interfaces, and concrete (encircled)
The analysis of KIC values given in Tables 1 and 3, as well as in Fig. 7, allows drawing the following conclusions.
Without concrete, the interfaces have relatively high KIC values, especially KKs, for which the KIC is greater than 2. The presence of flintstone is generally characterized by high KIC values even in the presence of thin carbonaceous interlayers. The absence of flintstone, such as in the case of GG, is characterized by reduced KIC values. For pure concrete, KIC has values close to those for the GG interfaces. For rock-concrete interfaces, KIC values are extremely low. This can be explained by weak adhesion when forming the contact between them. The difference is especially evident when comparing the averages. The average KIC value for the specimens without concrete is 1.327 MPa×√m, the average value for concrete is 0.858 MPa×√m, and for the specimens with concrete it was 0.323 MPa×√m, which is 4 times less than that for the specimens without concrete and 2.5 times less than that for the concrete specimens.
As follows from the data of summary Table 1, in most cases, the appearance of a fracture in a specimen middle part in bending tests leads to a decrease in both velocity Vp and velocity Vs. The changes were considered to be significant if they were beyond ±2% of the original pre-test value. The proportion of specimens whose velocity Vp appeared unchanged, amounted to 42%, and that whose velocity Vs remained unchangable, 40%. At the same time, half of the specimens showed a decrease in Vp, while Vs showed both decrease and increase in equal proportions. F0 и Q−1 showed a change in all cases.
Quantification of the changes in the mean values of Vp and Vs shows insignificant decreases, they amounted to 0.992 and 0.964 of the initial values. However, such small changes may not be a sufficiently reliable result. At the same time, the average value of Q−1 (loss factor) for a fracture formation due to a test showed an increase of 1.32 times that can be used to assess the condition of the interface between a rock and concrete when organizing nondestructive testing or monitoring of actual facilities.
Establishing the feasibility of predicting KIC based on the acoustic properties of facilities is one of the important related objectives. In this case, such an assessment is made on the basis of the correlation coefficient R and root-mean-square deviation (RMS). The correlation coefficients of different combinations of acoustic properties with KIC of the specimens with rock-concrete interfaces were calculated using Statistica software. The results are presented in Table 4.
As follows from these data, the highest interdependence of KIC and Vp is observed. When multivariate statistics is used, other properties allow the correlation coefficient to increase slightly. At the same time, even in this case at R = 0.685, although interdependence exists, it cannot be considered as very strong. Root-mean-square deviation RMS characterizes the accuracy of such a forecast. In this case, the root-mean-square deviation was 0.098 MPa×√m. The average value of KIC was 0.323 MPa×√m. The relative accuracy was about 30%.
Table 4
The relationship between the velocities of elastic waves Vp, Vs, loss factor Q−1 in different combinations and KIC coefficient for specimens with rock-concrete interfaces
Indicator | Vp | Vs | Q−1 | Vp, Vs | Vp, Q−1 | Vs, Q−1 | Vp, Vs, Q−1 |
R | 0.674 | 0.447 | 0.190 | 0.685 | 0.675 | 0.533 | 0.685 |
RMS | 0.093 | 0.306 | 0.124 | 0.099 | 0.096 | 0.110 | 0.098 |
Conclusion
The relevance of the experimental study of a rock-concrete interface fracture toughness coefficient KIC was shown, which can be used in practice in mining industry in the design, construction, and operation of surface and underground structures, such as shafts and permanent mine workings, hydroelectric dams, road and railroad tunnels, as well as other both underground and aboveground facilities having rock-concrete interface.
The current study investigated the fracture toughness of rock interfaces involving gypsum stone and concrete. For the rock-concrete interfaces, the values of the fracturing toughness coefficient of the first strain mode KIC are extremely low. This can be explained by weak adhesion when forming the contact between them. The difference is especially evident when comparing the averages. The average KIC value for the specimens without concrete is 1.327 MPa×√m, the average value for concrete is 0.858 MPa×√m, and that for specimens with concrete is 0.323 MPa×√m, which is 4 times less than that of the specimens without concrete and 2.5 times less than that of the concrete specimens.
Evaluation of the effect of an arising fracture on average values of longitudinal Vp and transverse Vs elastic wave velocities shows negligible reductions, which are 0.992 and 0.964 of the initial (pre-test) values, respectively. At the same time, the loss factor Q−1 at the formation of a tensile fracture due to testing shows an increase of 1.32 times, which can be accepted as statistically significant.
An evaluation of the feasibility to predict KIC coefficient based on the acoustic properties showed that the highest correlation was observed with Vp velocity. When multivariate statistics is used, other properties allow the correlation coefficient R to increase slightly. At the same time, even in this case at R = 0.685, the correlation cannot be qualified as strong, although the relationship exists. The relative accuracy in this case is 30%.
The obtained results can be used in the design, operation, as well as organization of nondestructive testing and monitoring of industrial facilities of mining enterprises.
References
1. Kochanov A. N., Odintsev V. N. Wave prefracturing of solid rocks under blasting. Journal of Mining Science. 2016;52(6):1080–1089. https://doi.org/10.1134/S1062739116061613 (Orig. ver.: Kochanov A. N., Odintsev V. N. Wave prefracturing of solid rocks under blasting. Fiziko-Tekhnicheskiye Problemy Razrabotki Poleznykh Iskopayemykh. 2016;(6):38–48. (In Russ.))
2. Zvereva A. S., Sobissevich A. L., Gabsatarova I. P. Coda Q in the geophysical medium of the Northeast Caucasus. Fizika Zemli. 2024;(1):140–156. (In Russ.) https://doi.org/10.31857/S0002333724010091
3. Grabkin O. V., Zamaraev S. M., Lashchenov V. A. et al. Geology and seismicity in the BAM region (from Baikal to Tynda). Structural-material complexes and tectonics. Novosibirsk: Nauka Publ. House; 1983. 192 p. (In Russ.)
4. Griffith A. A. The phenomena of rupture and flow in solids. Philosophical Transactions of the Royal So-ciety of London. Series A, Containing Papers of a Mathematical or Physical Character. 1921;221(582–593):163–198. https://doi.org/10.1098/rsta.1921.0006
5. Murakami Yu. (Ed.) Handbook of stress intensity coefficients. Vol. 2. Moscow; Mir Publ. House; 1990. 1016 p. (In Russ.)
6. Sezgin J.-G., Bosch С., Montouchet A. et al. Coupled hydrogen and phosphorous induced initiation of internal cracks in a large 18MnNiMo5 component. Engineering Failure Analysis. 2019;104:422–438. https://doi.org/10.1016/j.engfailanal.2019.06.014
7. Wang Y., MacDonald A., Xu L. et al. Engineering critical assessment and variable sensitivity analysis for as-welded S690 steels. Engineering Failure Analysis. 2020;109:104282. https://doi.org/10.1016/j.engfailanal.2019.104282
8. Beygi R., Carbas R. J. C., Barbosa A. Q. et al. A comprehensive analysis of a pseudo-brittle fracture at the interface of intermetallic of η and steel in aluminum/steel joints made by FSW: Microstructure and fracture behavior. Materials Science and Engineering: A. 2021;824:141812. https://doi.org/10.1016/j.msea.2021.141812
9. Eskandari S., Andrade Pires F. M., Camanho P. P. et al. Analyzing the failure and damage of FRP composite laminates under high strain rates considering visco-plasticity. Engineering Failure Analysis. 2019;101:257–273. https://doi.org/10.1016/j.engfailanal.2019.03.008
10. Mega M., Banks-Sills L. Comparison of methods for determination of fracture toughness in a multi-directional CFRP laminate. Procedia Structural Integrity. 2020;28:917–924. https://doi.org/10.1016/j.prostr.2020.11.064
11. Ryabchikov A., Kiviste M., Udras S.M. et al. The experimental investigation of the mechanical properties of steel fibre-reinforced concrete according to different testing standards. Agronomy Research. 2020;18:969–979. https://doi.org/10.15159/ar.20.070
12. Conforti A., Minelli F., Plizzari G.A., Tiberti G. Comparing test methods for the mechanical characterization of fiber reinforced concrete. Structural Concrete. 2018;19(3):656–669. https://doi.org/10.1002/suco.201700057
13. Valean C., Maravina L., Marghita M. et al. The effect of crack insertion for FDM printed PLA materials on Mode I and Mode II fracture toughness. Procedia Structural Integrity. 2020;28:1134–1139. https://doi.org/10.1016/j.prostr.2020.11.128
14. Wang Y., Hu X. Determination of tensile strength and fracture toughness of granite using notched three-point-bend samples. Rock Mechanics and Rock Engineering. 2017;50(1):17–28. https://doi.org/10.1007/s00603-016-1098-6
15. Rong H., Wang Y. J., Zhao X. Y., She J. Research on fracture characteristics of rock-concrete interface with different roughness. Gongcheng Lixue/Engineering Mechanics 2019;36(10):96–103. (In Chinese) https://doi.org/10.6052/j.issn.1000-4750.2018.09.0485
16. Kožar I., Torić Malić N., Simonetti D., Smolčić Ž. Bond-slip parameter estimation in fiber reinforced concrete at failure using inverse stochastic model. Engineering Failure Analysis. 2019;104:84–95. https://doi.org/10.1016/j.engfailanal.2019.05.019
17. Kožar I., Bede N., Mrakovčić S., Božić Ž. Layered model of crack growth in concrete beams in bending. Procedia Structural Integrity. 2021;31:134–139. https://doi.org/10.1016/j.prostr.2021.03.022
18. Lu D. X., Bui H. H., Saleh M. Effects of specimen size and loading conditions on the fracture behaviour of asphalt concretes in the SCB test. Engineering Fracture Mechanics. 2020;242:107452. https://doi.org/10.1016/j.engfracmech.2020.107452
19. Nazerigivi A., Nejati H. R., Ghazvinian A., Najigivi A. Effects of SiO2 nanoparticles dispersion on concrete fracture toughness. Construction and Building Materials. 2018;171:672–679. https://doi.org/10.1016/j.conbuildmat.2018.03.224
20. Seitl S., Ríos J. D., Cifuentes H. Comparison of fracture toughness values of normal and high strength concrete determined by three point bend and modified disk-shaped compact tension specimens. Frattura ed Integrità Strutturale. 2017;11(42):56–65. https://doi.org/10.3221/IGF-ESIS.42.07
21. Ouchterlony F., Franklin J. A., Zongqi S. et al. Suggested methods for determining the fracture toughness of rock. International Journal of Rock Mechanics and Mining Sciences & Geomechanics Abstracts. 1988;25(2):71–96.
22. Voznesenskii A. S., Osipov Y. V., Ushakov E. I. et al. Effect of weak inclusions on the fracture toughness of interfaces between various rocks. Engineering Failure Analysis. 2023;146:107140. https://doi.org/10.1016/j.engfailanal.2023.107140
23. Voznesenskii A. S., Osipov Y. V., Ushakov E. I., Semyonov Y. G. Fracture toughness of interfaces between various minerals and rocks. Procedia Structural Integrity. 2023;46:155–161. https://doi.org/10.1016/j.prostr.2023.06.027
24. Mochugovskiy A. G., Mikhaylovskaya A. V., Zadorognyy M. Y., Golovin I. S. Effect of heat treatment on the grain size control, superplasticity, internal friction, and mechanical properties of zirconium-bearing aluminum-based alloy. Journal of Alloys and Compounds. 2021;856:157455. https://doi.org/10.1016/j.jallcom.2020.157455
25. Blanter M. S., Golovin I. S., Neuhäuser H., Sinning H. R. Internal friction in metallic materials. A handbook. Springer Series in Materials Science. Springer-Verlag Berlin, Heidelberg; 2007. 541 p.
26. Ushakov E. I., Voznesenskii A. S. The fracture toughness of interfaces between rocks and concrete. The results of experimental investigations. Mendeley Data. 2024;1. https://doi.org/10.17632/792rfcf59m.1
About the Authors
А. S. VoznesenskiiRussian Federation
Aleksandr S. Voznesenskii – Dr. Sci. (Eng.), Professor of the Department of Physical Processes of Mining and of Geocontrol
Moscow
Scopus ID 57210211383
E. I. Ushakov
Russian Federation
Egor I. Ushakov – PhD student of the Department of Physical Processes of Mining and of Geocontrol
Moscow
Scopus ID 57467483000
Ya. O. Kutkin
Russian Federation
Yaroslav O. Kutkin – Cand. Sci. (Eng.), Associate professor of the Department of Physical Processes of Mining and of Geocontrol
Moscow
Scopus ID 56554219800
Review
For citations:
Voznesenskii А.S., Ushakov E.I., Kutkin Ya.O. Fracture toughness of rock-concrete interfaces and its prediction based on acoustic properties. Mining Science and Technology (Russia). 2025;10(1):5-14. https://doi.org/10.17073/2500-0632-2024-10-316


