


Contents
Scroll to:
https://doi.org/10.17073/2500-0632-2025-06-993
Scroll to:
The Kargoba mineral occurrence in East Kazakhstan covers an area of 25.5 km2 and is characterized by rugged mountainous terrain at elevations of 800–1,013 m above sea level. This study presents a methodology for high-resolution unmanned aerial vehicle (UAV)-based aeromagnetic surveying aimed at targeting copper-molybdenum mineralization. The study sought to identify geophysical targeting criteria and refine the boundaries of prospective zones. The survey was conducted using a DJI Matrice 300 RTK quadcopter equipped with a Geoshark MG30GM quantum magnetometer. Magnetic-field interpretation included derivative-based transforms, namely the tilt derivative (TDR), first vertical derivative (VDR), and total horizontal derivative (THDR), as well as three-dimensional modeling of magnetic sources. Six anomalous zones were delineated. Zone A-2 was identified as the highest-priority exploration target, exhibiting an anomaly amplitude of up to 500 nT and a spatial association with a granodiorite intrusion. The following criteria were established for targeting porphyry mineralization: anomaly amplitudes of 200–500 nT, horizontal gradients exceeding 3 nT/m, anomaly strike lengths of 0.5–2 km, spatial association of positive and negative magnetic anomalies, and spatial correlation with hydrothermal alteration zones. Comparison of the identified anomalies with published data from the Lavrion district in Greece supported the applicability of the selected approach. A key diagnostic feature is the spatial association of anomalies of opposite polarity, reflecting the structural and geological controls on mineralization. The high spatial resolution of the aeromagnetic survey at Kargoba enables more precise delineation of prospective mineralized zones and more effective positioning of exploration drillholes. The use of a UAV considerably facilitates and accelerates surveying in rugged and inaccessible terrain. Compared with conventional ground surveys and crewed airborne surveys, it reduces survey time and costs while maintaining high data quality. The proposed approach therefore offers a cost-effective, lower-risk means of targeting concealed mineralized bodies and extends the capabilities of mineral exploration in remote regions.
Orazbekova G.B., Mataibayeva I.E., Zimanovskaya N.A., Ragdanova A.A., Sarsembayeva A.S. UAV-based aeromagnetic surveying for exploration targeting at the Kargoba copper-molybdenum occurrence. Mining Science and Technology (Russia). 2026;11(2):107-121. https://doi.org/10.17073/2500-0632-2025-06-993
The effective prediction of concealed orebodies in remote and inaccessible areas remains an important challenge in modern mineral exploration [1]. Conventional aeromagnetic surveys conducted using crewed aircraft have several major limitations, including high costs, complex logistics, and insufficient spatial resolution in areas of rugged terrain. These limitations can be addressed through the use of unmanned aerial vehicles (UAVs) equipped with high-sensitivity magnetometers [2]. In recent years, this approach has been increasingly adopted, substantially improving the accuracy and spatial resolution of aeromagnetic surveys [3–5].
Despite the clear advantages of UAVs, their use presents several methodological and technical challenges, including terrain-following flight-path planning, electromagnetic interference generated by the UAV itself, accurate positioning, and maintaining the specified flight altitude [4]. Furthermore, the interpretation of high-resolution magnetic data requires algorithms and software capable of identifying and reliably interpreting anomalies associated with different geological sources [6, 7].
Similar spatial analysis and mineral-resource prediction problems have also been successfully addressed for other types of mineral resources using computer modeling. For example, a GIS-based modeling methodology was developed for common non-metallic minerals hosted in the Cenozoic deposits of the Brest Region. The methodology can be used to predict mineral deposits and assess their development potential with due consideration of geological and land-use factors [8].
Alongside advances in geophysical exploration methods, automated mineralogical analysis techniques are also being actively developed. In particular, convolutional neural network-based approaches have been proposed for segmenting ore minerals in digital images of polished sections, enabling highly accurate identification of mineral phases [9]. These developments reflect a broader transition in mineral exploration toward quantitative, reproducible, and automated data-processing methods.
Thus, the aim of this study is to develop and test an integrated methodology combining high-resolution UAV-based aeromagnetic surveying, advanced data processing and interpretation techniques, and the geological characteristics of the Kargoba mineral occurrence. To achieve this aim, the following tasks were addressed: UAV-based aeromagnetic surveying of the study area; magnetic data processing and transformation; construction of a 3D magnetization model to a depth of 500 m; delineation and classification of anomalous zones; and identification of priority targets for further exploration.
Aeromagnetic surveying is based on measuring variations in the Earth’s magnetic field caused by contrasts in the magnetic susceptibility of rocks. Under potential-field theory, anomaly sources can be represented by equivalent source bodies in three-dimensional space, enabling filtering and inversion methods to be used to reconstruct the source structure1. The method is particularly suitable for areas characterized by extensive magmatism and ore-related intrusions, such as the Kargoba area. Porphyry-system models indicate that hydrothermal-metasomatic alteration zones near the apices of intrusions display a marked geophysical contrast with the surrounding rocks and can therefore be effectively delineated by aeromagnetic surveying [10].
UAV-based aeromagnetic surveying was selected to obtain high-resolution magnetic-field data over rugged terrain that is difficult to cover using conventional crewed airborne surveys [11].
The use of a quantum magnetometer and magnetic-data processing techniques, including reduction to the pole, the first vertical derivative, the total horizontal derivative, and the tilt derivative (TDR), followed procedures previously applied in international studies [12–14].
The aeromagnetic data were processed in two stages. Initial processing and assessment of field-data quality were performed on site, while final data processing was completed after the field survey. Geosoft Oasis montaj2 was used for data processing and routine quality control.
The contribution of this study is the adaptation of the established methodology to the mountainous terrain of East Kazakhstan, modifying an interpretive tomography algorithm used to construct the 3D model in Voxler to account for the dimensions and acquisition parameters of the survey block, and establishing criteria for identifying anomalies considered prospective for mineralization by comparison with known deposits of a similar type.
1 Report on supplementary geological investigations and inferred resource assessment for map sheets L-44-V, XI, and XVII (Kazakhstan sector). Kapchagai Geological Exploration Expedition LLP, Almaty; 2016. Principal investigators: A. V. Dubinkin, A. K. Akhmatolla, V. V. Podkovyrov et al.
2 Seequent. Oasis montaj. URL: https://www.seequent.com/products-solutions/oasis-montaj/
A DJI Matrice 300 RTK multirotor UAV served as the airborne platform for the aeromagnetic survey3.
UgCS Pro software4 was used for flight planning, UAV control and monitoring, and the real-time display of telemetry data transmitted by the UAV.
Magnetic measurements were acquired with a Geoshark MG30GM rubidium quantum magnetometer mounted on the UAV [15].
Initial data processing was performed concurrently with data acquisition, on a daily basis after the field crew returned to the field base. Data from the airborne magnetometer and the magnetic base station were transferred to the processing computer and imported into Geosoft Oasis montaj databases. The data were edited by removing the run-in segments preceding each survey line and the turns between adjacent lines. The completeness and quality of the raw data were then visually checked, and a preliminary magnetic-field map was progressively updated as new data became available.
For visual quality control of the data acquired along each survey line, Geosoft Oasis montaj was used to display profiles of the measured total magnetic field (Ta), the International Geomagnetic Reference Field (IGRF) calculated at the magnetometer elevation, temporal variations in the geomagnetic field recorded at the magnetic base station (MVS_RMg), ground elevation derived from SRTM data, and magnetometer elevation (Elev_Mg_27 m). An example of these database profiles is shown in Fig. 1.

Fig. 1. Example visualization of aeromagnetic survey database elements for lines L1034 (a) and L1042 (b)
Aeromagnetic survey error was evaluated from differences between repeat-line and survey-line measurements and from crossover differences at intersections between survey lines and tie lines. The results are presented in Table 1.
Table 1
Aeromagnetic survey error estimated from repeat-line measurements
| No. | Line | Line length, m | Mean difference, nT | Standard deviation, nT |
| 1 | L1036:0 | 1,231 | 0.24 | 2.23 |
| 2 | L1087.2:0 | 1,844 | 2.04 | 4.53 |
| 3 | L1092.2:0 | 2,122 | –0.28 | 1.00 |
| 4 | L1093.2:0 | 2,236 | 0.37 | 0.38 |
| 5 | L1101.2:0 | 1,450 | 0.27 | 0.44 |
| 6 | L1113:0 | 1,761 | –3.34 | 5.48 |
| 7 | L1122:0 | 2,145 | –0.23 | 0.94 |
| 8 | L1123:0 | 2,113 | 0.68 | 1.52 |
| Total | 14,903 | 0 | 2.99 | |
Repeat-line measurements covered 14.9 line km, accounting for 6.2% of the combined length of the survey and tie lines, compared with the 5% specified in the technical requirements. Based on the differences between repeat-line and survey-line measurements, the estimated error of the Kargoba aeromagnetic survey was ±2.99 nT. The maximum permissible error specified in the technical requirements was ±5 nT, increasing to ±7 nT in areas of high magnetic-field gradients. Fig. 2 shows two representative profiles. Line L1036 displays a positive magnetic anomaly with an amplitude of approximately 200 nT, whereas line L1087 displays a high-amplitude anomaly of up to 500 nT.

Fig. 2. Comparison of survey-line and repeat-line magnetic-field measurements for two representative profiles:
L1036, showing a positive anomaly of moderate amplitude (a); and L1087, showing a high-amplitude anomaly (b)
Aeromagnetic survey error at crossover points between tie lines and survey lines was estimated for locations where the horizontal magnetic-field gradient was below 50 nT/km using the root-mean-square error formula:

where δi is the difference between the final ΔT readings at the crossover points, nT; n is the number of δ differences.
Analysis of the magnetic-field values at 485 crossover points yielded a root-mean-square error of ±3.46 nT.
Following final data processing, the complete magnetometric database was compiled, and grids of the anomalous magnetic field and its most informative transforms were calculated.
Maps of the magnetic field and its most informative transforms are presented in Figs. 3–9.
Fig. 3 shows the anomalous magnetic-field model for the Kargoba area as a contour map generated using Surfer software.
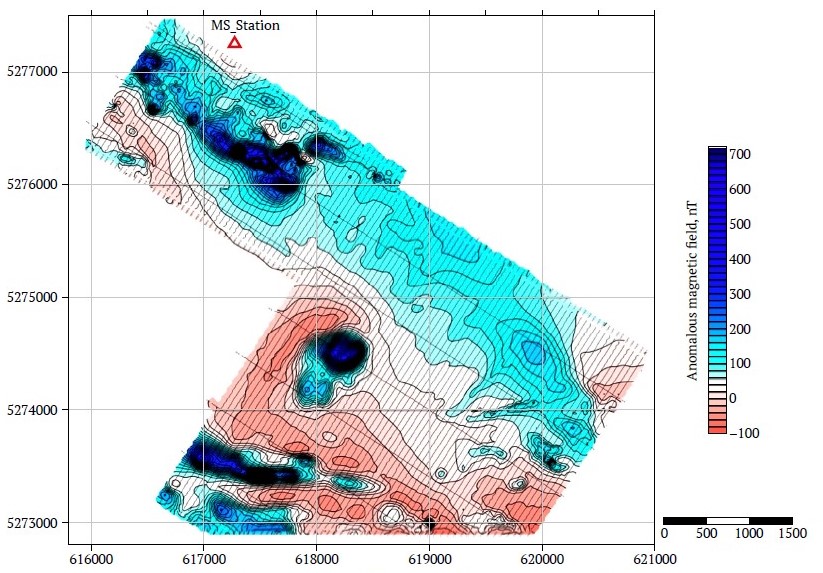
Fig. 3. Contour map of the anomalous magnetic field
In accordance with the applicable mapping specifications, the map uses shades of red for negative anomalous magnetic-field values and shades of blue for positive values.
A profile map showing the amplitude and variation of ΔT along the survey lines was used for the initial assessment of data quality and the spatial distribution of the anomalous magnetic field. Analysis of the anomaly pattern identified zones with pronounced local peaks, potentially corresponding to geological bodies with strong magnetic susceptibility contrasts. Comparison of these zones with the magnetic- field transforms shown in Figs. 4–8 confirmed the presence of buried magnetic sources associated with intrusive bodies.
The anomalous magnetic field was also displayed using the Image Maps raster mode in Geosoft, providing a clearer representation of the overall anomaly morphology and its distribution across the survey area. At another stage of data processing, a Shaded Relief display was applied to better define the morphology of the major anomalies.
Before detailed interpretation, the anomalous magnetic field over the Kargoba area was reduced to the pole (see Fig. 4). Reduction to the pole transforms the observed magnetic field into the field that would theoretically be measured at the geomagnetic pole, where both the Earth’s magnetic-field vector and the magnetization of the source rocks are vertical. In theory, the maxima and minima of reduced-to-the-pole anomalies generated by subsurface sources should be centered over the causative bodies, as is generally the case for gravity anomalies. The magnetic anomalies should also become approximately monopolar, with their associated opposite-polarity lobes largely suppressed, thereby providing a clearer overall anomaly pattern.

Fig. 4. Reduced-to-the-pole anomalous magnetic field
Reduction to the pole, like most other magneticfield transformations, was performed using Geosoft Oasis montaj™. The inclination and declination used in the calculation were 68.65° and 5.21°, respectively.
The morphology of the anomalous magnetic field indicates that its sources occur at different structural levels. Accordingly, one of the principal interpretation tasks is to separate the magnetic-field contributions of sources located at different depths.
The high-frequency component of the magnetic field is most clearly expressed in the first vertical derivative (VDR) (see Fig. 5). The vertical-derivative transform enhances the high-frequency component of the magnetic-field spectrum, emphasizes features associated with relatively shallow local sources, and suppresses the low-frequency component. Compared with the original field, the first vertical derivative provides sharper delineation of the upper edges of magnetically active bodies.
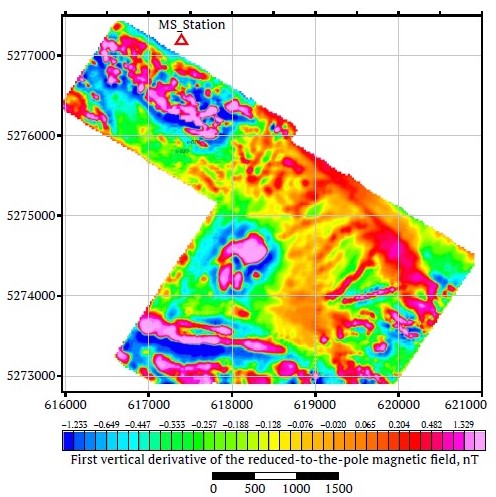
Fig. 5. First vertical derivative of the reduced-to-the-pole magnetic field
More accurate delineation of the boundaries of magnetic sources can be achieved by analyzing the distribution of the total horizontal derivative (THDR). Magnetic-field gradients are free from the linear background associated with large regional anomalies and the normal regional gradient. In the THDR field, the boundaries of anomalies with different amplitudes are marked by extrema, allowing the outlines of both weak and strong anomalies to be visualized simultaneously. Linear zones of maximum THDR values delineate anomalous areas, trace steps and inflection lines in the original magnetic field that can be correlated with extensive geological contacts and faults, and emphasize the boundaries of tectonic blocks5.
For comparison with the vertical components of the anomalies, the total horizontal derivative of the magnetic field was also calculated. This transform provided a more accurate estimate of the lateral boundaries of the sources; however, it proved less informative than the first vertical derivative (see Fig. 5) and the analytic signal (see Fig. 6).
Fig. 6 shows a map of the analytic signal amplitude of the magnetic field.

Fig. 6. Analytic signal of the anomalous magnetic field
The analytic signal amplitude (AS) of the anomalous magnetic field is defined as:
AS = √(VDR2 +THDR2) ,
where VDR is the first vertical derivative and THDR is the total horizontal derivative of the magnetic field.
The analytic signal amplitude is useful for delineating magnetic-source boundaries and is independent of both the dip of the anomaly-producing geological bodies and the latitude of the survey area. Like the total horizontal derivative, the analytic signal can be used to trace contacts between magnetic units, refine source locations, and delineate the upper edges of magnetic bodies.
The Tilt derivative (TDR) is widely used as an alternative to the first vertical derivative (VDR) for enhancing fine-scale features of the magnetic field:
TDR = tan−1[VDR / THDR].
The tilt angle is expressed in radians. TDR extrema have nearly equal amplitudes of approximately ±1.5 and clearly identify the maxima and minima of the original field regardless of their intensity. The TDR enables reliable mapping of the positions and edges of source bodies and facilitates the tracing of structural features within the survey area. TDR extrema correspond to the axes of the source bodies, whereas zero values mark their boundaries. The TDR is considerably less dependent on the amplitude of the original-field anomalies than the first vertical derivative, total horizontal derivative, and analytic signal. It therefore provides clearer delineation of the axes of weak anomalies associated with deeper sources. The TDR is comparable to a residual-anomaly field and enhances the fine structure of the magnetic field.
The tilt-derivative map of the Kargoba area is shown in Fig. 7. The total horizontal derivative of the tilt angle (TDR-THDR) enhances and traces the edges of magnetic sources. This transform is not affected by ringing, which can generate spurious maxima, and therefore does not produce false edges. The amplitudes of the TDR-THDR maxima can be used to estimate the depths of source edges. The axes of zones with maximum TDR-THDR values trace the boundaries between bodies with contrasting magnetic properties.

Fig. 7. Tilt angle of the magnetic-field gradient vector relative to the horizontal
To examine the three-dimensional distribution of magnetic properties in the Kargoba area, 3D modeling was performed using an interpretive tomography algorithm. A model representing the equivalent distribution of magnetic sources was calculated using specialized filtering procedures applied to the original magnetic field. These procedures are implemented in the Express gravity-magnetic modeling and inversion module of the IP Seismic software package. The method is classified as interpretive tomography and does not require prior information about the target6.
The 3D magnetic model of the Kargoba area was calculated over a depth interval of 0–1,000 m, with elementary cell dimensions dX = 25 m, dY = 25 m, and dZ = 10 m. The resulting model, initially generated in SEG-Y format, was exported as an ASCII text table and imported into the Geosoft Oasis montaj™ database. Depths were converted to absolute elevations. The 3D grid was generated using the 3D Gridding / Kriging algorithm, and the model was visualized in Geosoft 3D. The cell dimensions of the Voxler 3D model of excess magnetization in the Kargoba area were 25 × 25 × 10 m.
Elements of the 3D magnetization model for the aeromagnetic survey area covering the Kargoba mineral occurrence are shown in Figs. 8 and 9.

Fig. 8. General view of the 3D magnetization model at depths of 0–500 m

Fig. 9. Zones of increased magnetization, (F > 11.4) a.u.
Magnetization values are expressed in arbitrary units. Higher values are shown in yellow, red, and pink, whereas lower values are shown in shades ranging from green and light blue to dark blue.
A schematic geological map of the Kargoba area at a scale of 1:25,0007 was used as the geological basis for interpreting the magnetic anomalies.
The schematic geological map of the Kargoba mineral occurrence is shown in Fig. 10.
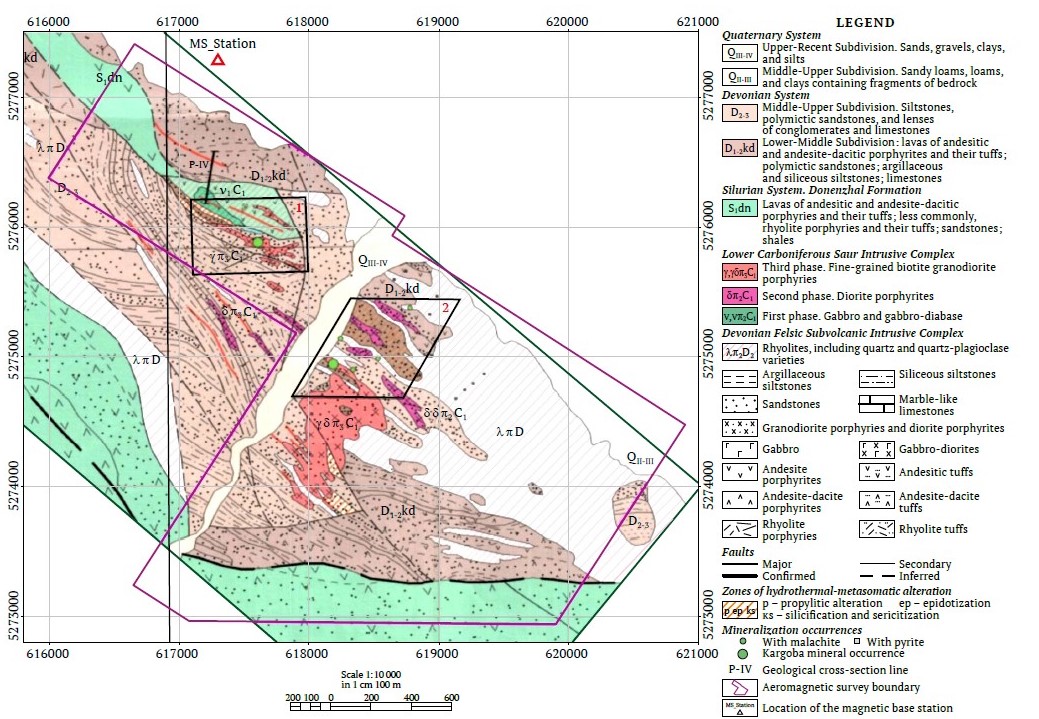
Fig. 10. Schematic geological map of the Kargoba mineral occurrence area
Source: Alimkhanov N. K., Bashkirtsev A. M., et al. Report on the project “Exploration of Prospective Areas in the Eastern Region”,
2005–2007. GRK Topaz LLP, Ust-Kamenogorsk, December 2007
3 DJI. Matrice 300 RTK. URL: https://www.dji.com/support/product/matrice-300
4 SPH Engineering. UgCS User Manual. URL: https://manuals.ugcs.com/
5 Shadrintsev M. P., et al. Report on the results of reconnaissance geological and geophysical surveys conducted in the Tarbagatai area in 1974–1975 (map sheets L-44-9-G; L-21-B-b, g; L-44-22-A-a, v). Altai Integrated Geological and Geophysical Expedition, Opytnoye Pole, May 1976.
6 Shadrintsev M. P., et al. Report on the results of reconnaissance geological and geophysical surveys conducted in the Tarbagatai area in 1974–1975 (map sheets L-44-9-G; L-21-B-b, g; L-44-22-A-a, v). Altai Integrated Geological and Geophysical Expedition, Opytnoye Pole, May 1976.
7 Report on supplementary geological investigations and inferred resource assessment for map sheets L-44-V, XI, and XVII (Kazakhstan sector). Kapchagai Geological Exploration Expedition LLP, Almaty; 2016. Principal investigators: A. V. Dubinkin, A. K. Akhmatolla, V. V. Podkovyrov et al.
Unlike conventional ground magnetic surveying, UAV-based surveys provide a denser and more uniform observation grid, particularly in remote and poorly accessible areas. This substantially improves mapping resolution and the reliability of spatial analysis of magnetic sources. For example, in conventional surveys with a station spacing of 50–100 m, the detection of small, thin local bodies at depths of up to 150 m may be hindered by spatial smoothing of the signal and terrain effects [16, 17].
The combined use of high-frequency transforms, such as the tilt derivative (TDR) and analytic signal, with UAV magnetic data provides a spatial resolution of 25–30 m, comparable to the drill spacing used during resource evaluation. Furthermore, unlike conventional inversion approaches involving upward continuation, the proposed method employs a regularized inverse solution adapted to the near-field conditions characteristic of low-altitude measurements at flight heights of 35–50 m.
Previous studies of UAV applications in porphyry systems, including those conducted in Peru and Central Asia [18], have focused primarily on overall mapping accuracy or the detection of large-scale structures. By contrast, the present study demonstrates the potential to identify concealed, localized bodies of possible economic significance through integrated analysis of magnetic-field transforms, 3D modeling, and geological correlation. The study therefore contributes to the development of methods for local depth interpretation of UAV aeromagnetic data.
The effectiveness of the proposed approach was evaluated at the Kargoba mineral occurrence, one of the less extensively studied sites in East Kazakhstan exhibiting indications of porphyry mineralization. To test the methodology under actual geological and structural conditions, previously available data were analyzed together with the newly acquired aeromagnetic data.
The Kargoba mineral occurrence was discovered in 1957. Aerogeophysical Team No. 31 of the Chingiz Division of the Volkov Expedition identified two areas of copper mineralization represented by pyrite, chalcopyrite, malachite, and azurite in bleached sandstones, granodiorite porphyries, and quartz porphyries. Trenches were excavated, and four boreholes up to 100 m deep were drilled. The boreholes intersected several mineralized intervals containing 0.1–0.5% Cu at depths of 12–92 m8.
In 1974–1975, the Tarbagatai Team of the Altai Integrated Geological and Geophysical Expedition9 conducted a comprehensive exploration program to investigate and evaluate the mineral occurrence in greater detail. The program included induced-polarization and self-potential electrical surveying on a 250 × 25 m grid, a soil geochemical survey on the same grid, trenching and test-pitting, 890 m of shallow drilling for geological mapping, and two exploration boreholes up to 300 m deep. The work established a veinlet-disseminated copper-molybdenum style of mineralization and its genetic association with a granodiorite intrusion.
Further investigations of the Kargoba occurrence were conducted in 2005–200710 over an area of 25.5 km2. The work was intended to refine the geological structure, examine the controls on mineralization, trace the mineralized zones northwestward and southeastward, and explore and evaluate the right-bank part of the occurrence. It included reconnaissance geological traverses, magnetic surveying on a 1,000–500 × 50 m grid, 467 m3 of trenching, and geochemical exploration based on primary dispersion halos, including bedrock sampling along reconnaissance traverses and geological-geochemical profiles, with a total of 773 samples collected.
The combined geological, geochemical, and geophysical evidence indicates the potential for economically significant mineralization on both the left and right banks. At least four orebodies with high copper and molybdenum grades have been delineated at the surface and to depths of up to 160 m on the left bank. The present erosion level is interpreted to expose only the uppermost part of the mineralized system. Average grades and orebody thicknesses may therefore increase with depth, and the individual orebodies may merge into a single body at deeper levels.
Exploration on the right bank of the Kargoba River delineated a major zone of silicification comprising pyrite-bearing quartz-sericite metasomatic rocks. The zone can be traced southeastward from the river for approximately 1 km and is 0.5–0.7 km wide. High concentrations of ore-forming elements occur within this zone in the area of granodiorite-porphyry outcrops.
There is therefore a high probability of identifying a porphyry copper mineralized system within an area of almost 1 km2 on the right bank, potentially comparable in scale and resources to that on the left bank.
The exploration program at the Kargoba copper-molybdenum occurrence delineated a highly prospective porphyry copper target recommended for follow-up prospecting, evaluation, and exploration.
The available data indicate that the granodiorite bodies are the principal source associated with copper-molybdenum mineralization. Their emplacement resulted in the formation of extensive zones of hydrothermal-metasomatic alteration containing ore mineralization. A belt of epidotized and silicified andesite and andesite-dacite lavas was also identified along the contact with the granite intrusion. The belt extends for 750–800 m in a near north-south direction and ranges from 10 to 80 m in width. Copper mineralization, represented by malachite along fractures in the rocks, is visible within this zone.
High molybdenum concentrations have also been recorded, and silver and gold may occur in potentially economic concentrations.
Despite the relatively small size of the survey area, its anomalous magnetic field is strongly differentiated. The lowest magnetic-field values coincide spatially with Middle-Upper Devonian siltstones and polymictic sandstones occupying the central part of the survey area and extending northwestward as a broad belt.
Devonian quartz and quartz-plagioclase rhyolite porphyries of the felsic subvolcanic intrusive complex, which are most widespread in the northeastern part of the study area, are expressed as a relatively low-gradient magnetic field of elevated intensity.
Mosaic-patterned positive magnetic-field values characterize areas underlain by lavas and tuffs of andesite and andesite-dacite porphyrites of the Silurian Donenzhal Formation. The most intense local positive magnetic anomalies are associated with granodiorite porphyries of the third phase of the Lower Carboniferous Saur Intrusive Complex.
The zones of positive magnetic anomalies delineated within the Kargoba mineral occurrence were numbered and plotted on the interpretation map shown in Fig. 11.
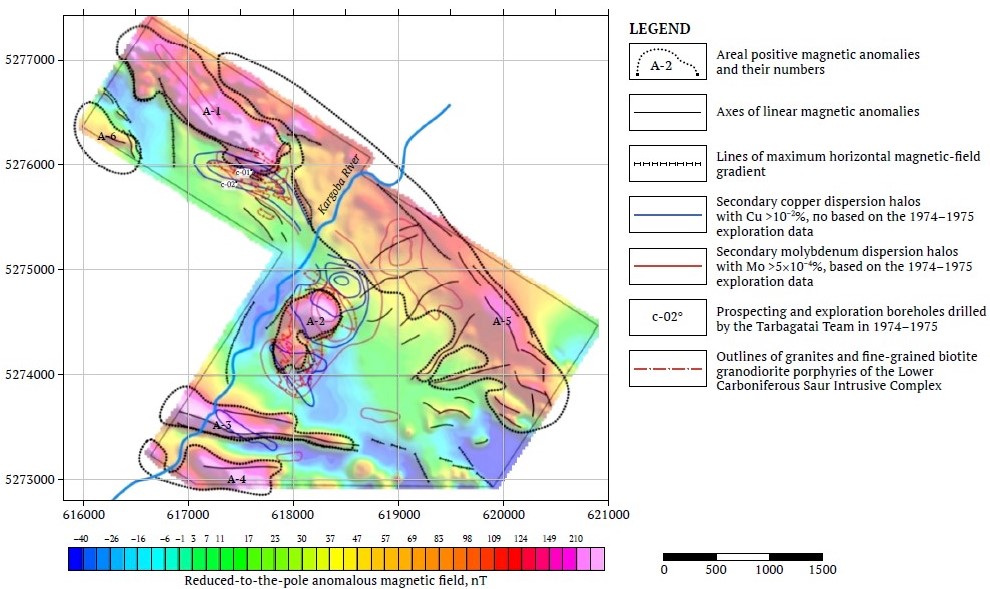
Fig. 11. Magnetic-field interpretation map showing exploration targets and major lineaments
Source: Dubinkin A. V., Akhmatolla A. K., Niyazov A. V., et al. Supplementary geological investigation and inferred resource assessment
for map sheets L-44-V, XI, and XVII (Kazakhstan sector): unpublished geological report. Almaty: Kapchagai Geological Exploration
Expedition LLP; 2016
The magnetic survey delineated six zones of positive magnetic anomalies within the Kargoba area.
A-1. This zone is located in the northwestern part of the survey area, measures approximately 2 × 0.5 km, and is elongated northwestward. Its position and strike are consistent with the geological boundaries shown on the schematic geological map of the Kargoba mineral occurrence. The anomalous zone has a complex, irregular mosaic pattern, with individual magnetic maxima reaching 400, 500, and 800 nT. The anomaly probably has a composite source comprising andesite and andesite-dacite porphyrite lavas together with granodiorites and diorites of the Saur Intrusive Complex.
A-2. This anomalous zone is located on the left bank of the Kargoba River and broadly coincides with the mapped exposure of a granodiorite-porphyry stock of the Saur Intrusive Complex. It comprises four discrete magnetic maxima. The northern maximum is approximately isometric in plan view, measures 400–500 m in diameter, and has an amplitude of 480 nT. Additional local maxima to the west and south are slightly elongated in a near north-south direction, measure approximately 100–150 × 150–250 m, and have amplitudes of 180–200 nT.
A-3. This zone occurs in the southern part of the survey area. It comprises a chain of local magnetic maxima forming a single east–west-trending linear zone measuring approximately 2,000 × 200–250 m. The local maxima have amplitudes ranging from 180 to 400 nT. Zone A-3 is spatially associated with the contact between andesite porphyrites of the Silurian Donenzhal Formation and the Middle-Upper Devonian sequence of siltstones and polymictic sandstones. The magnetic anomalies may be caused by granodiorites of the Saur Intrusive Complex emplaced along east-west-trending faults.
A-4. Approximately 400 m south of A-3, close to the boundary of the magnetic survey area, zone A-4 was delineated within an area underlain by Silurian andesite and andesite-dacite porphyrites. The zone measures approximately 1,200 × 250 m and contains individual positive magnetic maxima with amplitudes of up to 250 nT.
A-5. This northwest-trending linear zone, located in the northern part of the magnetic survey area, measures approximately 4,500 × 500–1,200 m and is characterized by elevated magnetic-field values of up to 150–180 nT. On the geological map, the zone coincides with outcrops of rhyolite porphyries belonging to the Devonian felsic subvolcanic intrusive complex.
A-6. This zone represents part of a low-amplitude positive magnetic anomaly of 110–120 nT in the southwestern corner of the survey area. The geological map shows Middle-Upper Devonian polymictic sandstones in this area. The anomaly may be related to small Devonian subvolcanic rhyolite-porphyry bodies.
From an exploration perspective, A-2 is the most prospective zone for porphyry copper mineralization. The geometry and amplitude of the magnetic response associated with the granodiorite-porphyry stock are broadly comparable to the anomalies recorded over the Yubileynoye and Raigorodok gold deposits (Fig. 12). Exploration of this zone should therefore assess its potential for both copper and gold mineralization.
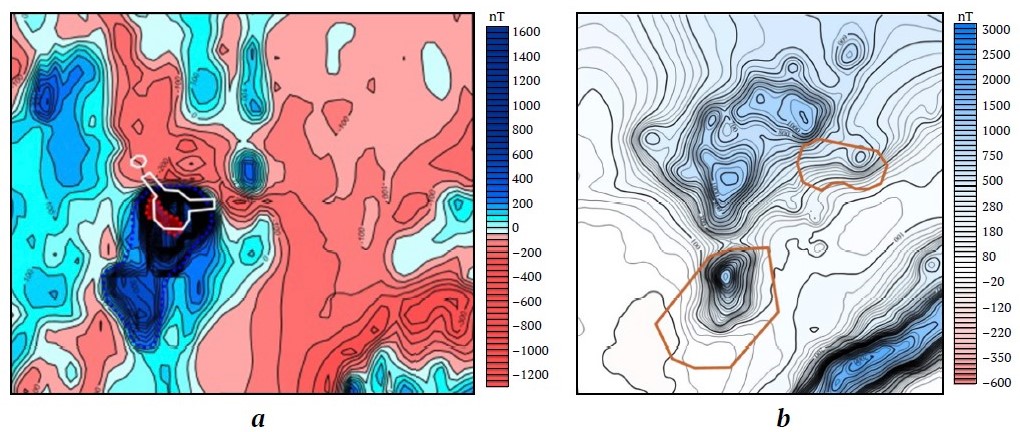
Fig. 12. Anomalous magnetic field over the Yubileynoye (a) and Raigorodok (b) gold deposits
The Yubileynoye deposit is located in Aktobe Region, Republic of Kazakhstan, on the western limb of the Kunduzdy Syncline. It is associated with a stock of biotite-hornblende plagiogranite porphyry intruding basalts and andesite-basalts of the Mugodzhar Formation and surrounded by intensely silicified rocks.
Gold mineralization occurs in hydrothermally altered rocks both along the peripheral part of the intrusion and within the intrusion itself. The orebodies comprise stockwork zones formed by a dense network of veinlets 0.1–10 cm thick. Locally, the veinlet network becomes sufficiently dense to form massive quartz-rich metasomatic rocks. The ores are of the moderately sulfidic type. The principal minerals in the primary ores are chalcopyrite, pyrite, magnetite, native gold, and stibnite. Accessory ore minerals include sphalerite, galena, pyrrhotite, marcasite, and rutile. Gangue minerals comprise quartz, calcite, dolomite, epidote, albite, chlorite, actinolite, and sericite.
In addition to gold, copper, and silver, the disseminated quartz-sulfide ores contain 0.001–0.1% arsenic and antimony and 0.01–0.2% zinc. Molybdenum, lead, scandium, gallium, yttrium, ytterbium, bismuth, and tungsten occur sporadically at concentrations of up to several thousandths of a percent.
The deposit coincides with an intense, nearly isometric positive magnetic anomaly. Its high amplitude may reflect both the high magnetic susceptibility of the granodiorite-diorite intrusive rocks and hornfelsing of the overlying host rocks.
The Raigorodok ore field is spatially associated with local magnetic anomalies of 800–1,000 nT. The North Raigorodok ore field occurs at the contact between a gabbro-diorite-monzonite massif and an Upper Ordovician conglomerate sequence near an apical projection of the massif. The host rocks are intensely granitized and skarn-altered.
The orebodies range in strike length from several tens of meters to 400 m and in thickness from a few meters to several tens of meters. They are separated by barren rock packages and subeconomic interbeds whose thicknesses are comparable to those of the orebodies. Gold is distributed unevenly within the ores. Gold grades are generally low, commonly 0.5–2.5 g/t, while silver grades are of a similar order.
The South Raigorodok deposit is hosted in the endocontact and exocontact zones of a small dioritic to gabbro-dioritic intrusive body that cuts an Upper Ordovician sequence of coarse-clastic to boulder conglomerates. The orebodies comprise irregular zones of gold-bearing veinlet-disseminated sulfide mineralization containing pyrite, chalcopyrite, galena, and molybdenite. Their geometry is particularly complex at the intersections of fracture zones with different orientations. The mineralized zones range from 1–2 to 35–40 m in thickness, and gold grades range from trace levels to 150 g/t.
The Central Raigorodok mineral occurrence is associated with the supra-apical part of a small stocklike diorite body. The orebodies consist of zones of veinlet silicification 0.5–1 m thick and occur mainly along contacts between diorite and diorite-porphyry dikes and the enclosing conglomerates. Gold grades range from 0.3 to 10 g/t.
By analogy with these deposits, exploration is recommended in the area of magnetic anomaly A-2 at Kargoba for both copper and gold. The most prospective targets are hydrothermally altered rocks both in the peripheral exocontact zone and within the intrusion itself. The geophysical exploration program should also include gamma-ray spectrometry to identify and map zones of secondary alteration and high-precision detailed gravity surveying to characterize the three-dimensional density structure of the intrusion.
This analogue-based approach to target delineation is supported by the results of digital elevation model analysis in the Aktogai ore field [19]. That study showed that major porphyry copper deposits, including Aktogai and Aidarly, are expressed in the topography as localized caldera-like depressions. Areas with similar morphometric characteristics were therefore considered prospective for further exploration. This interpretation is consistent with the delineated A-2 zone, which is likewise characterized by the combined presence of positive magnetic anomalies, hydrothermal alteration, and structurally controlled landforms.
8 Shadrintsev M. P., et al. Report on the results of reconnaissance geological and geophysical surveys conducted in the Tarbagatai area in 1974–1975 (map sheets L-44-9-G; L-21-B-b, g; L-44-22-A-a, v). Altai Integrated Geological and Geophysical Expedition, Opytnoye Pole, May 1976.
9 Ibid.
10 Alimkhanov N. K., Bashkirtsev A. M., et al. Report on the project “Exploration of Prospective Areas in the Eastern Region”, 2005–2007. GRK Topaz LLP, Ust-Kamenogorsk, December 2007.
The aeromagnetic survey provided a detailed 1:5,000-scale magnetic dataset to support further exploration at the Kargoba mineral occurrence. The survey was conducted using a modern low-altitude UAV-based acquisition system comprising a DJI Matrice 300 RTK and a rubidium quantum magnetometer. This technology combines the high maneuverability of a UAV with the high sensitivity of the magnetometer. It enables high-precision aeromagnetic surveying at very low altitudes with detailed terrain following over both level ground and rugged terrain. Compared with ground magnetic surveying, the new system increased survey productivity severalfold and provided substantially greater detail and spatial resolution than conventional aeromagnetic surveys conducted using crewed aircraft.
The magnetic data were processed and interpreted using modern techniques and software. The calculated magnetic-field transforms enabled the separation of components associated with structural elements of different scales and source depths within the magnetic model.
The study achieved its objective by demonstrating the effectiveness of high-resolution UAV-based aeromagnetic surveying for delineating concealed zones of porphyry mineralization. New qualitative and quantitative data were obtained, including a 3D magnetization model extending to a depth of 500 m. Six anomalous zones were delineated from this model, of which A-2 was identified as the priority target for further investigation. The inferred orebody parameters include depths of 50–150 m and a strike length of approximately 2 km. The spatial association between the magnetic anomalies and the granodiorite intrusion was confirmed. The identified geophysical criteria – anomaly amplitudes of 200–500 nT, strike lengths of 0.5–2 km, the occurrence of paired anomalies, and their spatial association with granodiorites – support the prospectivity of the area for porphyry copper-molybdenum mineralization.
The results demonstrate that the proposed methodology can be applied in comparable geological settings and provide a reliable basis for subsequent drill testing, with a high likelihood of intersecting potentially economic mineralization.
1. Gonzalez-Alvarez I., Goncalves M. A., Carranza E. J. M. Introduction to the special issue challenges for mineral exploration in the 21st century: Targeting mineral deposits under cover. Ore Geology Reviews. 2020;126:103785. https://doi.org/10.1016/j.oregeorev.2020.103785
2. Pei Y., Liu B., Hua Q. et al. An aeromagnetic survey system based on an unmanned autonomous helicopter: Development, experiment, and analysis. International Journal of Remote Sensing. 2017;38(8):3068–3083. https://doi.org/10.1080/01431161.2016.1274448
3. Walter C., Braun A., Fotopoulos G. High-resolution unmanned aerial vehicle aeromagnetic surveys for mineral exploration targets. Geophysical Prospecting. 2019;68(1):334–349. https://doi.org/10.1111/1365-2478.12914
4. Zheng Y., Li S., Xing K., Zhang X. Unmanned aerial vehicles for magnetic surveys: a review on platform selection and interference suppression. Drones. 2021;5(3):93. https://doi.org/10.3390/drones5030093
5. Malehmir A., Dynesius L., Paulusson K. et al. The potential of rotary-wing uav-based magnetic surveys for mineral exploration: a case study from Central Sweden. The Leading Edge. 2017;36(7):552–557. https://doi.org/10.1190/tle36070552.1
6. Lv W., Huang P., Yang Y. et al. A novel method of magnetic sources edge detection based on gradient tensor. Minerals. 2024;14(7):657. https://doi.org/10.3390/min14070657
7. Abdelrady M., Pham L. T., Mohamed A. et al. Application of the new edge filters of aeromagnetic data to detect the subsurface structural elements controlling the mineralization in the Barramiya area, Eastern Desert of Egypt. Journal of King Saud University – Science. 2024;36(11):103539. https://doi.org/10.1016/j.jksus.2024.103539
8. Bogdasarov M. A., Mayevskaya A. N., Petrov D. O., Sheshko N. N. GIS modeling of a Cenozoic strata structure in Brest region for forecasting and evaluation of non-metallic deposits. Mining Science and Technology (Russia). 2024;9(4):328–340. https://doi.org/10.17073/2500-0632-2024-03-230
9. Korshunov D. M., Khvostikov A. V., Nikolaev G. V. et al. From visual diagnostics to deep learning: automatic mineral identification in polished section images. Mining Science and Technology (Russia). 2025;10(3):232–244. https://doi.org/10.17073/2500-0632-2025-05-416
10. Vallée M. A., Moussaoui M., Khan K. Case studies of magnetic and electromagnetic techniques covering the last fifteen years. Minerals. 2024;14(12):1286. https://doi.org/10.3390/min14121286
11. Lu N., Xi Y., Zheng H. et al. Development of a hybrid fixed wing uav aeromagnetic survey system and an application study in chating deposit. Minerals. 2023;13(8):1094. https://doi.org/10.3390/min13081094
12. Pham L. T., Oliveira S. P. Edge enhancement of magnetic sources using the tilt angle and derivatives of directional analytic signals. Pure and Applied Geophysics. 2023;180:4175–4189. https://doi.org/10.1007/s00024-023-03375-y
13. Pham L. T., Smith R. S., Oliveira S. P., Jorge V. T. Enhancing magnetic source edges using the tilt angle of the analytic-signal amplitudes of the horizontal gradient. Geophysical Prospecting. 2024;72(8):3026–3037. https://doi.org/10.1111/1365-2478.13573
14. Abdelrahman K., Pham L. T., Oliveira S. P. et al. Reliable Tilt-depth estimates based on the stable computation of the tilt angle using robust first vertical derivatives. Scientific Reports. 2024;14:7392. https://doi.org/10.1038/s41598-024-57314-5
15. Geoscan. Geoshark MG30GM Quantum Magnetometer. Available online: https://www.geoscan.ru/ru/products/geoscan401/geophysics (Accessed on 13 June 2026).
16. Efrem R., Coutu A., Saeedi S. Suspended magnetometer survey for mineral data acquisition with vertical take-off and landing fixed-wing aircraft. 2024. https://doi.org/10.48550/arXiv.2402.11797
17. Efrem R., Coutu A., Saeedi S. Sensor Integration and Performance Optimizations for Mineral Exploration Using Large-scale Hybrid Multirotor UAVs. 2024. https://doi.org/10.48550/arXiv.2402.11810
18. Lu N., Xi Y., Zheng H. et al. Development of a hybrid fixed-wing UAV aeromagnetic survey system and an application study in chating deposit. Minerals. 2023;13(8):1094. https://doi.org/10.3390/min13081094
19. Seib N., Belov Yu., Zimanovskaya N. et al. Analysis of a digital terrain model for solving geological problems by the example of Aktogai ore field. Mining Science and Technology (Russia). 2025;10(3):245-261. https://doi.org/10.17073/2500-0632-2025-06-422
Gulizat B. Orazbekova – PhD (Geology and Mineral Exploration), Lecturer, Department of Automation and Information Technologies
Semey
Scopus ID 57215986570
Indira E. Mataibayeva – PhD, Associate Professor, School of Earth Sciences
Ust‑Kamenogorsk
Scopus ID 57195672336
Natalya A. Zimanovskaya – PhD, Associate Professor, School of Earth Sciences
Ust‑Kamenogorsk
Scopus ID 56369110800
Altynay A. Ragdanova – Lecturer, School of Earth Sciences
Ust‑Kamenogorsk
Assel S. Sarsembayeva – PhD, Cand. Sci. (Eng.), Professor
Semey
Scopus ID 56910207600
Orazbekova G.B., Mataibayeva I.E., Zimanovskaya N.A., Ragdanova A.A., Sarsembayeva A.S. UAV-based aeromagnetic surveying for exploration targeting at the Kargoba copper-molybdenum occurrence. Mining Science and Technology (Russia). 2026;11(2):107-121. https://doi.org/10.17073/2500-0632-2025-06-993




Editor-in-Chief
Petrov V.L. Email this article (Login required)
Email the author (Login required)
Email this article (Login required)
Email the author (Login required) 119049, Moscow, Leninsky Prospect, 4, b. 1
The National University of Science and Technology MISIS (NUST MISIS)
Tel.: +7 (968) 848-61-24
E-mail: send@misis.ru





