


Contents
Scroll to:
https://doi.org/10.17073/2500-0632-2026-02-1113
Scroll to:
The muonography method is an innovative method for obtaining information about the internal condition of massive natural features and industrial facilities using cosmic radiation particles, namely high-energy atmospheric muons. The method studies the features of the passage of these particles through extended objects located on the earth’s surface and below it that allows for the detection of hidden density anomalies and their monitoring. Muonography can be used to solve a wide range of applied problems, from searching for mineral resources to assessing possible natural and man-made risks for civil infrastructure. The method is based on the analysis of the characteristics of muon fluxes after they pass through a target (the subject of research: a natural feature, or industrial facility, etc.). The presence of hidden areas of increased or decreased density inside a target changes the number of muons that have passed through it. Probing muons are recorded using detectors installed below and/or to the side of the area under study. Comparing the recorded muon fluxes with the expected ones allows not only to conclude about the presence of a hidden area of increased or decreased density, but also to determine its location and estimate its dimensions. Muonography is a promising tool for solving geological and geophysical problems, not only as a supplement to traditional approaches, but also as an independent experimental method for searching for mineral deposits, forecasting and analyzing the consequences of seismic and volcanic processes, assessing deformations in fault zones in landslide areas, karst massifs, etc. The authors of the paper have more than ten years of experience in conducting muonographic experiments using nuclear emulsion detectors that record atmospheric muons. As a result, unique developments were performed regarding the experimental setup, processing, and analysis of data obtained using photographic nuclear emulsion. The paper discusses the prospects and features of the muonographic technique as applied to geological and geophysical research.
Konovalova N.S., Okateva N.M., Polukhina N.G., Strekalina D.M., Shchedrina T.V. Application of muonography method in geology and geophysics: opportunities and prospects. Mining Science and Technology (Russia). https://doi.org/10.17073/2500-0632-2026-02-1113
Muonography investigates the features of material density distribution inside large objects, such as mountain massifs or industrial buildings, using penetrating fluxes of atmospheric muons [1–3]. Analysis of the angular distributions of muons that have passed through a target (a natural feature or an industrial facility, etc.) allows for the non-invasive detection of density anomalies in the zone of the passing muon flux without mechanical intervention, and for the determination of the location and dimensions of these anomalies. In a muonographic experiment, the degree of absorption of atmospheric muons by different areas of a target, which may contain inhomogeneities with a density that differs from the density of its main mass, is compared. The number of muons that have passed through a target depends on the properties of the material and the length of the muon's path within it. When an area of material of a different density is encountered in the path of the particle flux, the intensity of the absorption of the muon flux in a given direction changes that can be recorded with the use of detectors.
The possibility of using cosmic radiation for "imaging" large surface and underground targets is provided by the physical properties of relativistic muons, which, possessing energy on the order of hundreds of TeV and higher, not only overcome distances comparable to the Earth's atmosphere before decaying, but also possess the ability to penetrate rock to a depth of up to 2 km. Passing through a substance, muon fluxes are attenuated due to energy losses mainly through ionization. When a more or less large foreign inclusion is encountered in the path of the particle flux, the intensity of interactions changes that leads to a change in the degree of absorption of the muon flux in a given direction. The method of muonography is based on this phenomena. By recording the difference in atmospheric muon fluxes passing through a target from different directions, this method allows for the localization of "hidden" areas with a foreign composition, thereby revealing areas of increased or decreased density within the target. Detectors that allow for the determination of the direction of the trajectories of the probing particles are installed to the side of or below the level of the zone being studied. The features of the experimental angular distributions of the registered muons allow one to judge the presence within the target of zones that differ in density from the main material.
A muonographic experiment is based on the search for hidden areas formed by materials whose density differs from the density of the main medium, and the higher this difference, the more effective the muonographic experiment. The minimum density difference at which the detection of an inclusion is possible is 5% [4]. To register a density anomaly, it is necessary to obtain a statistically significant difference in the number of muons that have passed through the main material and through this anomaly. Statistical significance in emulsion muonography is achieved through comprehensive analysis, which ensures a high signal-to-noise ratio. Within the framework of the set task (density difference, size of the target, distance from the detector to the target, etc.), for each individual experiment and exposure condition, an assessment of the exposure duration and the area of the emulsion detectors is performed to obtain statistically sound data.
The method can be used:
It should be noted that the use of the muonography method provides a real opportunity to prevent the occurrence of emergency situations or minimize their consequences for the population, infrastructure, and the environment.
Of particular interest is the application of the muonography method for solving problems of geological exploration and geo-ecological monitoring.
Competing methods in practical geology are underground gravity surveying and crosswell radio-frequency survey [5]. The basic principle used in traditional sounding methods is the measurement of the difference in physical properties. Despite the successes of traditional geophysical methods, their application is associated with significant problems, some of which are listed below. Gravity surveying is based on differences in the values of the gravitational effect arising depending on the distribution of masses. In underground gravity surveying, an uncertainty appears, associated with the fact that the total gravitational effect from overlying and underlying masses is recorded at points of the underground profile, and the problem of its breakdown arises. Existing methods for solving this problem are based on the assumption that the mass distribution above the observation profile is known, however, this is possible only if the density of rocks and inhomogeneities, their thickness, and the distance to the observation point are known. In a number of cases, these values are not known accurately enough that leads to errors in the interpretation of the obtained data. The depth of gravity surveying is comparable to the capabilities of muonography and can reach 1.5–2.5 km; however, the deeper a particular gravitating feature lies, the wider and more blurred the gravitational anomaly it creates on the Earth's surface. The error in determining the position of foreign inclusions is low and amounts to 20–30% under favorable conditions [5].
The crosswell radio-frequency survey method is based on differences in the absorption of Hertz waves by rocks and can be used to search for and delineate ore bodies. However, this method cannot provide information on such parameters as rock density or their mass distribution. Moreover, conducting work using this method requires an artificial source of electromagnetic radiation that naturally complicates and increases the cost of operations. This method requires at least two mine workings or boreholes for its implementation. At the same time, the equipment used has a relatively short range, especially in low-resistivity rocks, where Hertz waves almost completely attenuate at a distance of 100–120 m. Unlike the crosswell radio-frequency survey, the depth of the muonography method can reach 2 km, where cosmic muon fluxes can be recorded, although the exposure time to obtain statistically significant results reaches 6–7 months.
The accuracy of determining spatial density variations by traditional geological methods is no more than a few hundred meters under optimal data obtaining conditions that does not allow for the study of certain local structures related, in particular, to geophysical and lithological anomalies. Thus, the spatial resolution of seismological images is limited by the length of seismic waves (>1 km). In muonography, "noise" in the form of signal interference from different parts of the target is absent, because high-energy muons move through a material along almost rectilinear trajectories.
To describe the process of muon passage through complex targets, an algorithm presented in [6] is used, according to which a spatial model of the target is created, indicating the location of the detector and the coordinate system associated with it. The program was developed in the C++ language in the Visual C++ 2020 programming environment. The results of its operation using the target level lines are presented below. From the starting point, conditional rays are drawn that intersect a target and simulate the trajectory of muon movement, the direction of which is determined by the azimuthal angle φ and the zenith angle θ. Then, the intersection points of these rays with the boundaries of individual components of the target are found, and the path lengths of muons inside each component are calculated, taking into account the characteristics of the materials constituting them. The initial muon flux decreases as it passes through layers of material due to the absorption of less energetic particles. Considering the muon path in the material and its energy spectrum, it is possible to estimate the degree of flux reduction. In such a way, the final muon flux that will be registered by the detector is calculated. In the simulation process, the following parameters are taken into account: the shape of the energy spectrum of the vertical muon flux [7], the dependence of the muon flux intensity on the zenith angle θ, presented in the form F(θ) = cos2 θ, and the ionizing capacity of muons in various materials, taken from [8]. It is assumed that the initial flux does not depend on the azimuth, that is, F(φ) = const.
The sensitivity of the method (the accuracy of reconstructing the dimensions of an inhomogeneity) depends on the distance L traveled by muons in the material before falling onto the detector, and the area of the detector D. For example, for soil with a density of 2.3 g/cm3 the sensitivity of the method is 5% for L = 50 m, D = 1 m or L = 100 m, D = 3 m [6].
Among the advantages of the muonography method, one can note the lack of need to use artificial radiation sources and violate the integrity of the target, the lack of requirements for infrastructure (in particular, the presence of electrical networks), and operational control over the course of the experiment throughout the entire exposure.
Over the latest decades, the muonography method has been actively developing all over the world. Modern capabilities of muonography as applied to geophysical problems are presented, in particular, in review [2], where it is shown, that consistent construction of density maps allows studying the dynamics of volcanic activity and monitoring it. For instance, the goal of the muonographic study of the active Vesuvius volcano (MURAVES experiment [9]) is to analyze possible eruption scenarios for the volcano that has a rich history of catastrophic eruptions in an area with high population density. The experiment is conducted using an installation based on scintillation trackers located on the slope of the volcano approximately 1.5 km below the summit, which allow observing changes in the internal structure of the summit crater.
One of the possible scenarios for the application of muonography in glaciology is described in [10]. The goal of the planned experiment is to obtain information about the depth of the interface between the bedrock and the ice. As measuring equipment for determining the thickness of the glacier, it is proposed to use an electronic muon tomograph based on scintillation fibers, which allows obtaining and processing data in real-time mode. The experiment will allow investigating the seasonal behavior and melting trends of glaciers. Currently, the experiment is at the stage of testing the detector prototype in the field environment.
The implementation of muonographic projects in geological exploration is the subject of study [11], where recent developments are summarized and results of field studies, conducted in several countries, are presented. Proportional chambers are used as measuring equipment, which allow for an angular resolution of 0.5–1° to be achieved (for comparison, the angular resolution of nuclear emulsion detectors is 1–2 mrad). One of these experiments was conducted in the difficult conditions of an operating copper mine (Lubin, Poland), where the temperature exceeded +35 °C, and the humidity was 100%. During the first research session, these difficult conditions led to system malfunctions after several weeks of operation. To solve the problem, a radical improvement of the equipment was required, which allowed the period of uninterrupted operation to be extended to a year. As a result, values of the average density of the surrounding rock were measured, presented in Fig. 1 in polar coordinates for two measurement points at depths of 560 and 660 m, respectively, relative to the surface.

Fig. 1. Average rock density values measured in experiment [11] for two measurement points. Contour lines indicate distances from the detector to the surface. Average density values calculated from core drilling data are 2.2–2.3 g/cm3 depending on different directions
One more target for this experimental group is an open-pit mine in the city of Assarel (Bulgaria). The goal of the experiment is to find the fault zone between the host granitoid rock and the volcanic intrusion. The presence of a drainage tunnel, accessible for muonographic measurements, allowed for the installation of detectors at two observation levels, on the surface and underground. The task is complicated by the fact that the mine is in continuous operation, and the scene in the detectors' field of view changes regularly as new mining levels are created in the mine. Currently, a technique is being developed for muonographic monitoring of the constantly changing surface.
The range of research using the muonography method is rapidly growing, moving from the field of scientific research to the field of technological innovation. Since the 2000s, numerous commercial organizations around the world have been applying the muonography method for the purposes of geological exploration, construction, and nuclear safety. Among the largest companies are Geoptic Ltd, UK (analysis of subsurface structure density); Ideon Tech Inc., Canada; Lingacom, Israel (mining, ore body delineation, construction, etc.); MUODIM, France (internal condition of blast furnaces); Muon Solutions, Finland (geological exploration, study of flooded mines, cargo inspection); Muon Systems, Spain (monitoring the condition of blast furnaces and industrial structures); Muon Vision, USA (mineral exploration) and many others.
However, muonography also has a number of limitations. As noted in [2], the muonographic imaging method is limited to a distance of 2–3 km that muons can travel to be detected at a statistically significant level, and is applicable only to near-surface depths located above the muon detector that is due to the absorption of muon fluxes in the ground and the fact that atmospheric muon fluxes come exclusively from the upper hemisphere with the result that only the horizontally integrated density above the detector is measured with a time resolution exceeding several weeks. In addition, the capabilities of the method strongly depend on the features of the local topography. The disadvantages of both methods can be compensated for by combining muonographic data with data obtained using geophysical methods. The feasibilities of the joint application of muonography and gravimetry [12–14], seismic tomography [15], and satellite interferometric synthetic aperture radar [16] have been experimentally confirmed. The combination of these methods provides a more reliable and visual interpretation of monitoring signals.
In Russia, muonography is currently an innovative technique and is at the stage of conducting the first major experiments. There is growing interest in muonographic studies based on nuclear emulsion detectors, driven in part by the development of the production of high-quality domestic photographic nuclear emulsion, the creation of modern scanning equipment, and computer systems for analyzing large data sets.
Below is a description of existing and potential targets of muonographic research that are of interest for geological surveys and risk analysis for industrial facilities and infrastructure. The features of setting up experiments using nuclear emulsion detectors are discussed. The purpose of the presented work is to evaluate the applicability of the muonography method for solving problems of structural geology, exploration geophysics, and geo-ecological monitoring, based on the generalization of the authors' many years of experience in conducting muonographic experiments using nuclear emulsion detectors.
When preparing for muonography studies, it is necessary to check a number of conditions and carry out a set of preparatory work, including the collection of data about the target. This information comprises geographical, geological, and geophysical data, including topographic, hydrogeological, meteorological, and others ones, as well as information about the existing infrastructure in the area of the experiment.
Geological data include information about the composition, location, and distribution of rocks in the study area and are necessary for the interpretation of data obtained in a muonographic experiment. The presence of density inhomogeneities inside the target is determined by comparing the distributions obtained in the experiment with the distributions expected based on known geological data and obtained through modeling. The difference between the obtained angular distributions and the expected ones is a signal of the presence of hidden anomalies inside the target.
Topographic data are necessary to take into account the thickness of the rocks penetrated by muons. Information about the thickness of the material through which muons pass from the atmosphere to the detector can be obtained, for example, using calculated elevation profiles. These distributions are used both when planning the experiment and when interpreting its results. Thus, during muonographic studies in mountainous terrain, the surrounding mountain massifs can weaken the muon fluxes falling on the target to a level where the necessary signal cannot be obtained. Besides, the topography of the target is required to determine the optimal position of the detectors in the target. The detectors are installed in such a way as to obtain the necessary viewing angle with sufficient intensity of muon fluxes. To estimate the geometric dimensions of the investigated inhomogeneities, detectors are positioned on several sides around the target. An anomaly is considered detected if it is registered by more than one detector.
Meteorological requirements are determined by the capabilities of using photographic nuclear emulsion, which retains its technical properties only in the temperature range of ±30 °C.
The standard sequence of operations for muonographic studies is as follows:
1) Planning the experiment based on the set tasks and available data on the terrain features. The required number of detectors, their sizes, installation locations, and exposure duration at the target are determined, based on an analysis of incoming muon fluxes, taking into account the elevation above sea level. An assessment of the possible influence of surrounding structures and the landscape on muon fluxes is carried out.
2) Numerical modeling of the quantitative characteristics of muon fluxes expected in the detector's field of view after they pass through the target, taking into account the specifics of the experiment. Calculations are carried out under the assumption that the target does not contain density anomalies.
3) Preparation of measuring equipment (in this case, nuclear emulsion detectors) and its positioning at the target according to the developed experimental layout.
4) Processing and analysis of experimental data.
5) Comparison of the obtained experimental distributions with model calculations; localization of anomalous zones within the target based on this comparison.
6) Construction and visualization of a 3D model of the target's internal structure based on the results of the muonographic experiment.
In our experiments, when installing detectors for exposition, a system for referencing the detectors to landmarks on the terrain and to each other is created using modern geodetic methods and lidar survey, which allow determining the position of the detectors with centimeter accuracy. Since the detectors are located to the side of and/or below the target, the near-horizontal component of muon radiation is mainly used. The viewing angles of the detectors installed at the target intersect in such a way as to reconstruct a three-dimensional picture of hidden density inhomogeneities. Sometimes, for the optimal placement of detectors in relation to the study area (below the target level) and possible surrounding obstacles, it becomes necessary to use existing boreholes or drill new ones. The reliability of the applied methodology in each experiment is confirmed by recognizing visually observable targets, for example, architectural elements and buildings. Verification of the authors' experimental results is carried out by comparing the observed local inhomogeneities in the muon flux distributions with visually verifiable elements of a target located in the detectors' field of view. Over the latest decade, the authors have performed a series of successful muonographic experiments using nuclear emulsion detectors [4, 17, 18].
In global practice, muonographic experiments use either electronic [19–21] or emulsion (used by the authors) [22–24] detectors to register probing particles. An emulsion detector is an assembly of nuclear emulsion films packed under vacuum into lightproof and waterproof bags and fixed on a vertical or horizontal frame (Fig. 2, a). Such mounting of the nuclear emulsion layers ensures their minimal displacement in the detector relative to each other and, as a result, high-precision coordinate referencing of the tracks. Packaging of each film into a protective envelope (Fig. 2, b) is carried out before the start of the experiment and allows for the preservation of the technical properties of the emulsion for several months at the target, even under adverse weather conditions. These detectors are completely autonomous during the exposure period and do not require power sources or operational control over the progress of the experiment, for example, using electronic readout systems.
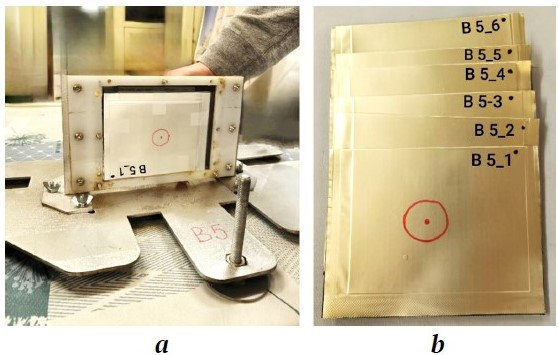
Fig. 2. Assembly of a nuclear emulsion detector for a muonographic experiment: a – assembled emulsion layers are fixed on a mounting frame (with the outer cover removed); b – nuclear emulsion layers in vacuum packaging made of light-proof aluminum bags with markings; the red circle indicates the "front" side of the detector
Each film consists of a thin plastic base 50 μm thick and 100 × 125 mm2 in area, covered on both sides with a layer of photographic nuclear emulsion (double-sided nuclear emulsion). The photographic nuclear emulsion contains a highly concentrated suspension of silver bromide (AgBr) crystals distributed in a gelatin medium. When a charged particle passes through a layer of nuclear emulsion, the AgBr crystals located along the particle's trajectory enter an excited state and form a latent image of the track. The activated state of the crystals is preserved until the chemical processing of the emulsion, as a result of which the developed silver grains become visible, forming the particle track. The sensitivity of Russian-made photographic nuclear emulsion is 25–30 grains per 100 μm of track length for a minimum ionizing singly charged particle, with an angular resolution of 1–2 mrad and a spatial resolution of 2–3 μm. The muon tracks detection efficiency in the nuclear emulsion is 85–90%. The production and chemical development of Russian nuclear emulsion are provided by JSC Slavich Company.
A micrometric volumetric image of the track is reconstructed under an optical microscope using a series of tomographic images at different depths of the developed emulsion (Fig. 3). The deviation of grains from the reconstructed particle trajectory, which the emulsion provides at a grain size of 0.3–1 μm, does not exceed 0.8 μm, and under certain conditions can be 0.2 μm.
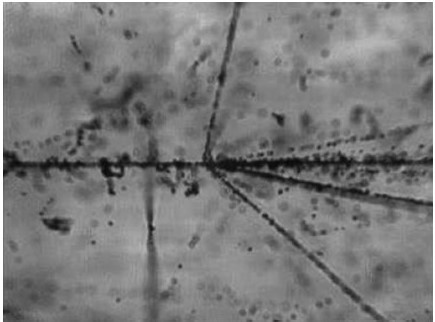
Fig. 3. Image of tracks of charged relativistic particles in nuclear emulsion
Some parameters for monitoring a large industrial facility or natural feature using the muonography method with emulsion detectors are given below.
Integral track detectors, which include photographic nuclear emulsion, accumulate information about particle tracks during the entire exposure time. This feature is a significant advantage at low fluxes of recorded particles, however, it leads to significant labor costs when processing and analyzing data. New capabilities of track detector technique are connected with achievements in the field of programmable scanning systems, which ensure high efficiency and speed of data processing.
When processing nuclear emulsions, modern scanning microscopes allow tracking the paths of recorded particles in the detector volume in real time, measuring particle momenta (by Coulomb scattering), their velocities and charges (by ionizing power), and conducting searches and identification of interaction and decaying points. Modern measuring equipment ensures scanning of double-sided emulsion films at high speed that is of fundamental importance for muonographic experiments with a large volume of data.
The authors perform scanning of nuclear emulsion films on the PAVIKOM (Fully Automated Measuring Complex), which is used to solve problems related to high-speed information support for the analysis of bulk and surface defects of the crystal lattice and material fracture at the nanostructural level and is successfully used for processing data from not only emulsion detectors, but also other solid-state track detectors (plastics, glasses, minerals) [25]. The complex's installations have the capability of non-stop scanning and image processing in real time, rapid adaptation to an experimental task, operation in multiprocessor systems, and participation in distributed computing. The scanning speed of emulsion films on PAVIKOM currently reaches 190 cm2/h.
The readings of a single muonographic detector indicate the direction to the suspected feature, but do not allow determining the distance between it and the detector. To estimate the position of a feature in space, it is necessary to combine the readings of several detectors installed at different points around the target, whose viewing angles would intersect in such a way as to reconstruct a three-dimensional picture of density inhomogeneities. The essence of the analytical method, described in detail in [17], consists in searching for local extrema of angular track distributions corresponding to density features in a selected direction, and intersections of these extrema recorded by several detectors installed at different points and directed at the studied area.
Muon trajectory directions are characterized by angles θ and φ, the angular part of spherical coordinates with a vertical axis directed perpendicular to the Earth's surface. Angular distributions of recorded fluxes are described by the function of the dependence of the number of muons on the track direction F(θ, φ), obtained in a certain solid angle. For each detector in the coordinate system associated with the surface, angular distributions of recorded tracks are constructed and the number of tracks in the solid angle element dφdθ is determined. When iterating through all possible directions in θ and φ, the positions of local extrema are determined from the number of recorded particles in the element dφdθ sequentially from φ for each given θ.
The space under study is conventionally divided into volume elements – cubes with a side of, for example, 0.5 m (the value depends on the conditions of a specific experiment and determines the accuracy of the experiment). In case of detecting a local extremum of the angular distribution of muons in the range of directions (φ, φ + Δφ) and (θ, θ+Δθ), the volume elements corresponding to this direction from a given detector are plotted on the extremum map. Extrema are considered statistically significant only if the numbers of muons in the compared bins (Δφ; Δθ) differ beyond the margin of error . Only those extrema are taken into account in which the number of muons, both in the bin/bins themselves constituting the minimum/maximum and in the adjacent bins, is greater than zero.
The result of this processing stage is the construction of the function G(X, Y, Z) with an interval for each spatial variable of 0.5 m, which allows for the detection of the intersection of local extrema from different detectors. If a volume element with coordinates X, Y, Z is intersected by a local extremum recorded by only one detector, the function G(X, Y, Z) is assigned a value of 1; if local extrema from two detectors intersect in a volume element, then G(X, Y, Z) = 2, and so on. The most probable locations of hidden density anomalies are found where local extrema from the largest number of detectors intersect.
Fig. 4 illustrates the data processing algorithm of a muonographic experiment to study the underground part of the temple complex of the Holy Dormition Pskov-Pechersky (Caves) Monastery, carried out by the authors in 2023 [17]. The purpose of the experiment was to search for previously unknown hidden rooms and galleries connected to the underground part of the Monastery. The results of processing 13 nuclear emulsion detectors installed in the galleries of the cave temple are shown. Fig. 4, a demonstrates the results of superimposing the function G(X, Y, Z) on the Monastery map at a fixed depth Z = 79–80 m relative to the Baltic Sea level. Similar functions were obtained for different depths in the range of 76–80 m. Blue indicates the directions of local maxima recorded by 1 detector, orange by 2 detectors, green by 3 detectors, red by 4 detectors, and black by 5 or more detectors. Partitions by angles Δφ = 1.5°, Δθ = 1.5°. As a result of the analysis of the obtained data, it became possible to discover previously unknown underground cavities of the cave temple, indicated in Fig. 4, b with color shading. Among them are a crypt behind the icon at the entrance to the cave temple measuring 2.5×2.5 m2 (cavity 1) and a corridor extending from it with a width of 1 to 3 m and a length of up to 12 m (cavity 2); a continuation of one of the "streets" of the cave temple along its main direction (cavity 4); a cavity of the same length extending from one of the caves (cavity 6), and several more smaller cavities.
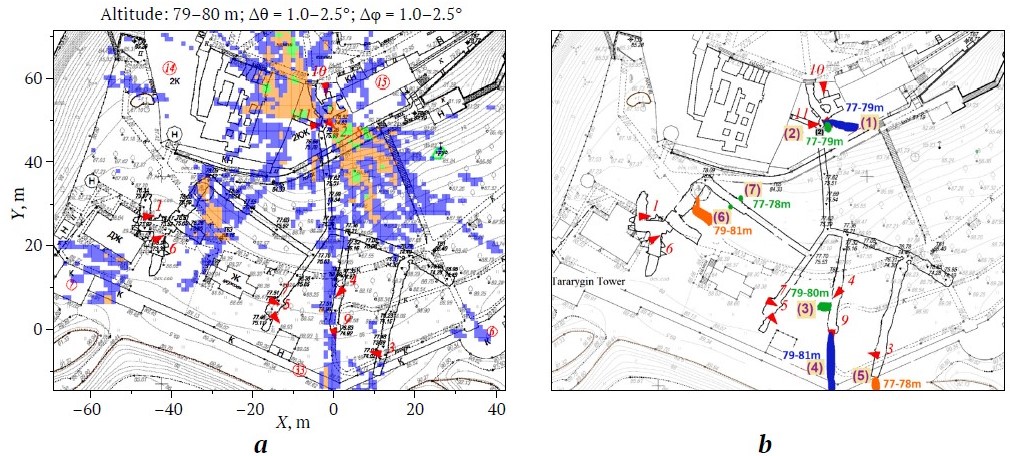
Fig. 4. Results of processing data from a muonographic experiment to search for hidden underground cavities in the temple complex of the Holy Dormition Pskov-Pechersky (Caves) Monastery (2023 experiment, 13 nuclear emulsion detectors): a – map of intersections of local maxima at a fixed depth Z = 79–80 m (plot of the function G(X, Y, Z)); b – map of the most probable position of the identified cavities with an indication of heights, constructed using the algorithm of intersection of local maxima of muon fluxes recorded by different detectors [17]
The parameters of the detected voids are comparable to the results of similar muonographic studies at other sites, for example, those presented in [26], where the extent of a previously unknown cavity discovered in the Great Pyramid of Giza is estimated to be at least 30 m with cross-sectional dimensions comparable to those of other galleries (approximately 8.6 m high × 1 to 2.1 m wide).
Muonography finds its application in monitoring volcanic, seismic, karst, and glaciological processes [9, 26, 27], for problems in mining industry [11, 28, 29], as well as for studying the internal condition of industrial facilities (for example, oil and gas complex facilities [30–32]). Some of the authors' proposals for the possible use of the muonography method in scientific and applied research are given below.
Along with the extraction of traditional hydrocarbons, the search for their additional sources, such as natural bitumen and extra-heavy oil in the upper horizons of the sedimentary cover, is becoming increasingly relevant. For shallow (50–250 m) deposits of extra-heavy oil, underground mine-based development options are the most effective. The effectiveness of the muonography method as an alternative to traditional exploration methods was confirmed by the authors during a 2025 study of a rocky area on Mount Shandor-Tau, conducted with the aim of searching for, localizing, and determining the geometric parameters of a layer of bituminous sandstone located inside it [18].
A possible target for investigation by the muonography method could be coal-rock dumps generated by coal deposits development, which are prone to spontaneous combustion. A characteristic feature of mining activities is the removal of large masses of overburden and/or host rocks, the volumes of which often exceed the volumes of the extracted mineral, mainly coal. Dumps receive rock from mines, processing plants, and coal enterprises. Burning dumps, the temperature of which at various depths can exceed 80°, pose a particular danger to the environment, and the combustion process can continue for 10 years or more. Gases emitted by burning dumps have a significant negative impact on the ecosystem of adjacent areas and are one of the main problems of coal-mining regions.
Ignition sources are cavities with elevated temperatures and an excess content of oxygen and carbon dioxide, i.e., areas with altered material density. These problematic areas can be identified by the muonography method even before the ignition stage, i.e., before an emergency situation arises. Investigating voids in the inner layers of coal-rock dumps using the muonography method with emulsion detectors will allow for assessing the potential threat of their spontaneous combustion and conducting monitoring for the purpose of subsequent targeted intervention on the ignition source.
Volcanoes are of great interest for geological, geochemical, and geophysical research, including the study of the features of their internal structure, the composition of volcanic material, and the stages of volcanic activity, with the aim of forecasting possible eruptions.
The authors are considering a project to investigate the vent of the Ebeko volcano (Paramushir Island, Kuril Islands), the geology of which has been poorly studied to date, using the muonography method. The Ebeko stratovolcano belongs to polygenetic volcanoes, i.e., it is subject to multiple eruptions. A pronounced rhythm is observed in the activity of the Ebeko volcano, in which periods of intense eruptions lasting from two to five years alternate with periods of relative calm with predominant gas emissions, lasting 20–30 years. Over the latest 100 years, 5 eruptions have occurred, the latest of which lasted more than 5 years, from October 2016 to November 2021. Periodic short-term explosions of moderate strength are characteristic of the volcano's eruptions, during which ash columns or plumes extending for several kilometers are formed. With such frequency and duration of eruptive events, the Ebeko volcano poses a threat to the population located in the immediate vicinity (only 6 km away in the town of Severo-Kurilsk), as well as to regional air traffic. As a result, the Ebeko volcano is a subject of intensive scientific research.
Ebeko volcano has an unusual structure consisting of three contiguous craters with diameters from 250 to 350 m and depths from 70 to 100 m, the Northern, Central, and Southern craters. The craters are surrounded by a semi-circular ridge with a diameter of 3–5 km, which represents the ruins of an ancient destroyed volcano around a younger inner volcanic cone. In the northeastern part of the Northern crater, there is an active vent – the eruptive center of modern eruptions. The basin of the Central crater is occupied by the waters of Goryacheye Lake, and in the Southern one, there are openings that are a source of hot gases.
Determining the structure of a volcano of high complexity, such as Ebeko volcano, using traditional methods requires collection data on dense network in harsh field conditions. A network of seismic stations has been established on Paramushir Island, designed to record seismic waves in order to determine the types of earthquake shocks that may become precursors to an impending eruption. Despite the fact that some areas of the volcano are under the observation of seismic stations, the eruption process carries an effect of unpredictability. For example, an eruption may occur not due to rise of pressure, but on the contrary, due to a loss of pressure inside the magma chamber, when the density of the rocks covering the magmatic chamber decreases, and the ability to retain the magma pressure is gradually lost. Such a process poses a great danger, because if lava forms not in the crater but on the slopes of the volcano, then under the force of gravity, the dome may collapse, causing a very large eruption. Therefore, to assess the potential activity of the volcano, it is necessary to study its internal structure, and above all, the magma chamber.
Studying the volcano using the muonography method will allow for determining the position of the magma chamber and the feeding paths of the main volcanic cone and, thus, will provide the necessary experimental data for predicting the timing and intensity of possible eruptions. Determining the size of the magma chamber and the degree of thermal impact on the rocks, as well as analyzing the associated geothermal processes, will allow for assessing the energy resources of the region. Observing the accumulation of magma in the chamber using direct methods is difficult and dangerous. The muonography method will allow for obtaining a 3D image of the features of the internal structure (primarily the volcanic vent) without direct contact with the subject of research. Muonographic studies will provide data for constructing a map (in angular coordinates) of the average density of rocks inside a volcano, will allow for identifying places of magma accumulation (magmatic chambers) and zones through which deep magma and fluids can reach the surface.
Numerous muonographic experiments on volcano research conducted in France, Italy, Japan, and other countries where active volcanic activity occurs [26, 27] have shown that muonograms allow for determining the structure of a volcano with higher accuracy than existing geophysical methods.
Landslides are one of the most dangerous geological phenomena along with volcanic eruptions and earthquakes and pose a serious threat to settlements and construction facilities. Landslides mainly form in mountainous terrain on slopes with a steepness of more than 15°. The geological structure and lithological composition of the slope rocks have a great influence on the development of landslide processes. Landslides most often occur when layers dip towards the slope (landslides of the Black Sea coast in the Sochi area) and can capture the slope to a depth reaching tens of meters. Periodically recurring landslides that destroy buildings, communications, and roads require the development of scientifically based approaches to monitoring landslide areas. The relevance of the topic for Greater Sochi is due to the presence of numerous territories subject to landslide processes.
Currently, the study of landslide phenomena is mainly the prerogative of geologists and geomorphologists [33–35]. Within the framework of the geological approach, the composition and properties of soils within the area of the landslide body, the characteristics of groundwater, site conditions, and possible geological processes are studied. Dynamic geomorphology studies the dynamics of the terrain in the landslide zone and the terrain-forming processes that determine it, considering landslides as dynamic systems that consist of different elements and possess complex structural connections.
In traditional geophysical survey methods, soil mechanics formulas are used to construct a landslide profile, in which indicators of the physical and mechanical properties of the soils composing the slope, determined by laboratory methods, are used. However, as noted in [33], most calculations are based on assumptions, and therefore the results of calculations for the same slope, obtained by different methods, do not always coincide. Muonography can become a reliable addition to a geo-ecological monitoring support system that combines various measurement and modeling methods.
Currently, the authors are conducting a muonographic experiment, the subject of which is a section of the landslide slope of Mount Bytkha in Greater Sochi. The subject of the research is the southeastern protrusion of Mount Bytkha, circumfluous from the northeast by the Matsesta River and from the south by the Black Sea (Fig. 5) and subject to landslide processes, which are facilitated by the increased fracturing of the rocks in the upper part of the strata section. Fractures reduce the strength of the rock mass and facilitate the penetration of water, which increases the risk of landslides, especially during artificial slope cutting and during periods of intense precipitation. Fracturing of rocks facilitates the filtration and movement of groundwater, which can lead to the appearance of temporary aquifers that appear after rain or snowmelt. This is important to consider when designing foundations and utilities. The Greater Sochi area is characterized by high seismicity, with Richter magnitude of about 8–9 (the latest earthquake with a magnitude of 3.0 with an epicenter on Mount Bytkha occurred on February 21, 2026), and fracturing zones can amplify the adverse effects of earthquakes, reducing rock stability and increasing the probability of destruction.
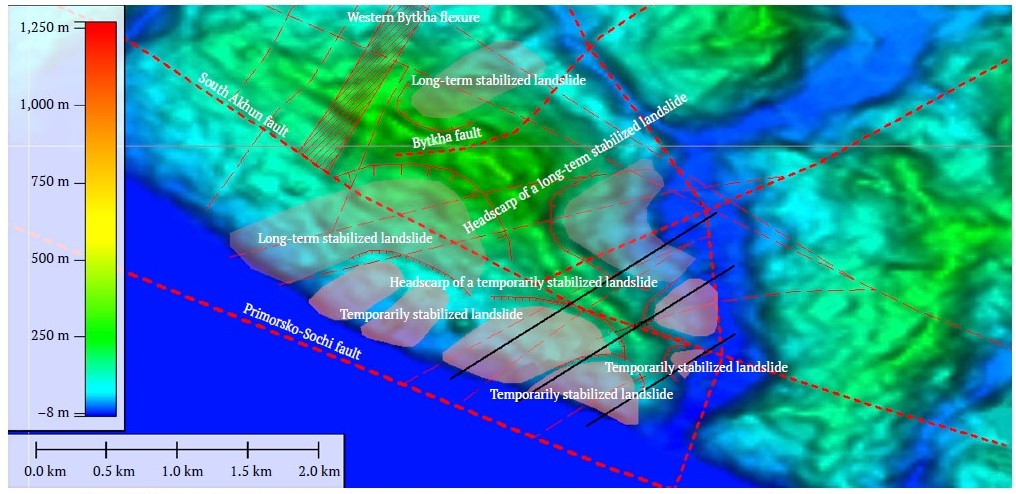
Fig. 5. The target of the muonographic experiment is the landslide slope of Mount Bytkha (Greater Sochi):
a – external view of Mount Bytkha; b – digital elevation model of the southeastern protrusion with known neotectonic disturbances (red dashed lines) and large landslides (pink areas)
The combination of a layered structure, fracturing, and variable moisture creates prerequisites for the development of slope-disturbing processes. At steep areas, local rockfalls and landslide displacements are likely, especially during periods of intense precipitation. The presence of dispersed soils (loams, clays) increases the sensitivity of slopes to water saturation and loss of stability. Landslide processes in the area of Mount Bytkha have intensified due to construction work that leads to the destruction of infrastructure and damage to roads and water pipelines. Muonography will allow for the detection of hidden voids, fractures, and weakening zones in rocks that is important for preventing collapses and ensuring the safety of residents and structures. The currently ongoing muonographic study of Mount Bytkha is aimed at investigating subsurface fracturing zones in order to identify areas prone to slow soil displacement, rock loosening, and other exogenous processes. The muonographic experiment on Mount Bytkha is aimed at solving the following specific problems:
The uniqueness of the subject of research lies in the combination of natural geodynamic activity and anthropogenic factors: urban development increases the load on slopes, and the activation of landslides triggers a cascade of secondary environmental effects. This turns Mount Bytkha into a model site for studying the interaction of natural and technogenic processes in mountainous regions. This study is an element of long-term monitoring of slope conditions and the prevention of catastrophic events. Taking into account fracturing zones is required for selecting optimal sites for construction, laying roads, utility networks, and other infrastructure facilities. Studying the fracturing zones of Mount Bytkha is critically important for ensuring geotechnical safety, the sustainable development of social agglomerations, the prevention of emergency situations, and rational nature management in complex geological conditions.
The preliminary selection of detector installation sites was made based on the results of a reconnaissance survey of the territory carried out in 2025. In addition to the possibility of viewing the study area, the availability of access roads and approaches to the detector locations was taken into account (Fig. 6).
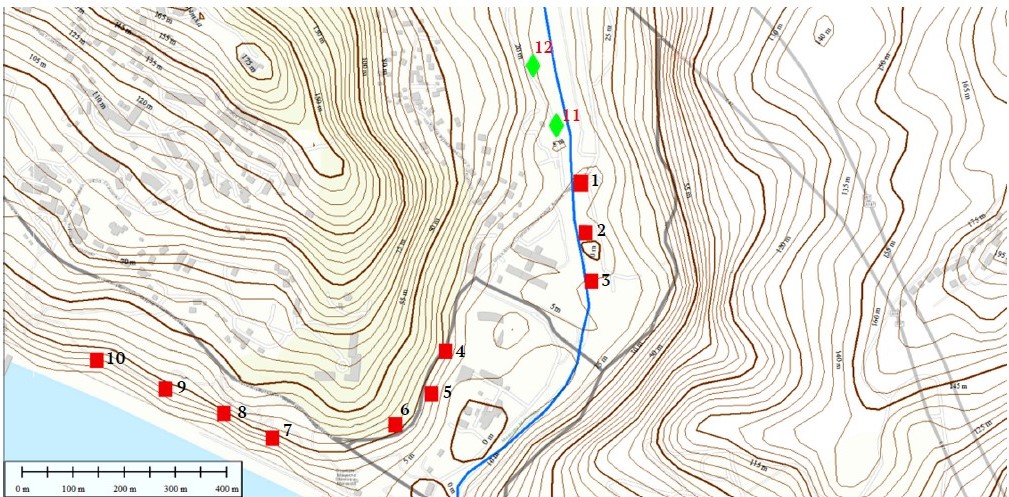
Fig. 6. Preliminary detector pattern (indicated by red squares with labels; green diamonds indicate additional detector installation sites if necessary)
The uniqueness and novelty of the experiment on Mount Bytkha lie in the fact that it will be conducted using near-horizontal muon fluxes that requires new approaches to its conduct, processing, and data analysis. The detector installation sites and their orientation are chosen in such a way as to minimize the absorption of muon fluxes by neighboring features (rock fragments, buildings), which can significantly distort the signal from the target. To determine the optimal viewing directions, terrain profiles were constructed in the vicinity of each detector, and the trajectories of muons falling on the detector at large zenith angles, which form the signal, were determined.
Analyzing the passage of near-horizontal muon fluxes through a target requires precise calculation of straight-line trajectories in all possible directions through each detector. A layout composed of isolines does not provide such a possibility. For correct research, the isoline layout was converted into a surface defined on a regular network in X, Y, and Z. The procedure was implemented in the AutoCAD software package using the linear interpolation method on an irregular network (TIN – Triangulated irregular network). Digitization verification was performed by constructing an elevation map based on the obtained regular network. For the correct conversion and definition of a regular network, a 0 m isoline corresponding to sea level was added to the isoline layout. To estimate the path length to each detector in each of the possible directions, an original algorithm was developed based on finding the intersection of a straight line, emerging from the detector at specified angles in a spherical coordinate system associated with the detector, with a surface defined in the target's coordinate system by a regular network. As a result of the algorithm's operation, a representation is formed of how the detector "sees" the target, that is, how the muon trajectory length changes depending on the angles to the detector axes. The input data for the algorithm are the regular network described above, which defines the target, and a table with the assumed positions and directions of the detectors.
For example, Fig. 7 shows the profiles along the muon registration axis for detectors 4 and 6. With this experimental geometry, the overwhelming majority of incoming muons will travel a distance exceeding 1 km through the mountain material.
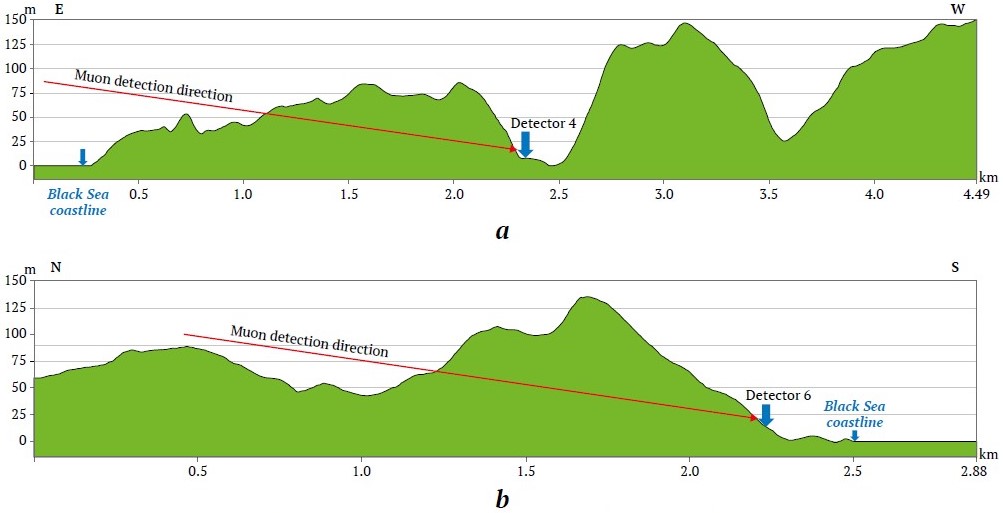
Fig. 7. Profiles along muon registration axis: a – for detector 4; b – for detector 6
Simulation of the expected detector signal for experiment optimization was carried out according to the algorithm described in [4]. The calculations used generally accepted dependencies of muon flux density on the zenith angle and muon energy loss in a material on the path traveled [7, 36].
Evaluation of experimental conditions for obtaining data with statistical significance beyond two statistical errors shows that to register a density difference of ∆ρ/ρ ~ 10%, sufficient for detecting a fracturing zone, the exposure time of the detectors at the target should be about 2 months, the total area of the emulsion detectors, ~2.5 m2, and the muon flux density, ~103 particles per detector.
To calculate the muon fluxes arriving at the detector from different directions, a vertical plane is drawn from its position on the terrain, performing a "cross-section" of the mountain in the direction specified by the azimuthal angle j. On the resulting "cross-section," lines are drawn from the detector position, passing through the target at a specific angle q to the horizon (see Fig. 7). The lengths of the segments of these lines L located inside the mountain define the muon path lengths within the mountain volume. Knowledge of the mountain material and the muon path lengths within it allows for the calculation of the absorption and fluxes of particles arriving at the detector.
Table 1 shows the calculation results for a given azimuthal angle j and various zenith angles q. The calculated number of muons N arriving at a detector with an area of 10×12.5 cm2 during two and a half months of exposure is presented (the indicated exposure time coincides with the effective one, since emulsion detectors do not require a break in operation). The energy spectrum of atmospheric muons is taken from [7]. The dependence of the minimum momentum value Pmin on the distance to the detector L was obtained by means of the algorithm described in [37], using the Geant4 software program. When calculating the number of particles N, the detector was assumed to be flat; the areas of parallel-located detectors were summed.
Table 1
Expected flux F and the corresponding number N of muons in the detector
Path of muons inside the mountain L, m | Zenith angle of muon trajectories to the horizon q, deg. | Minimum momentum value Pmin, GeV/s | Muon flux incident on the detector F, (m2 s avr.)−1 | Number of muons in the detector N, pcs |
420 | 10 | 211 | 0.02 | 5,100 |
515 | 8 | 270 | 0.013 | 3,300 |
610 | 6 | 334 | 0.009 | 2,900 |
830 | 4 | 487 | 0.005 | 1,280 |
1050 | 2 | 690 | 0.0027 | 700 |
In this case, most of muons will pass through no more than 800 m of the mountain material.
An estimate of the muon fluxes passing through the mountain at large zenith angles showed that to register 100 muons in a solid angle of dθ = 1º; dφ = 5º over two months of exposure, the required detector area is to be from 0.3 to 3 m2, depending on the location where the detector is installed. Reducing the exposure time will require a proportional increase in the detector area to maintain statistics.
To date, the first stage of the muonographic study of the Mount Bytkha landslide slope has been completed – experiment planning taking into account the features of the target (shape, size, surrounding structures, expected results, etc.). The next stage is the preparation and installation of detectors for exposure, scheduled for the summer of 2026.
At the Sirius University and NUST MISIS, the development of a methodology for muonographic survey of mineral deposits has been initiated, in particular, for identifying zones of probable mineral resource occurrence, the location of strata of different thicknesses, and the estimation of their parameters. Techniques are being developed for applying the muonography method to detect problem areas in the operation of oil and gas equipment (in particular, investigating the condition of the ground under and around site facilities), monitoring main pipeline systems, determining deformations of standard structures, etc. Structural failures of various large facilities related to human activity can also be the cause of natural and man-made disasters. Timely detection of hidden problem areas makes it possible to prevent the catastrophic development of a situation and ensure the safety of people and the saving of material resources. At present, this fundamental problem can be solved exclusively by the muonography method.
Since there are no standard approaches to setting up and processing a muonographic experiment, such experiment is an unique study. Muonographic experiments conducted by the authors since 2012 have demonstrated the practical applicability of muonography based on emulsion detectors and the feasibility of obtaining unique scientific results by sequentially solving methodological and analytical problems. Experimental experience allowed the authors to determine the factors influencing static and dynamic effects and to create an algorithm for visualizing the internal structure of the subjects of research. In particular, it was possible to detect and determine the geometry of previously unknown underground cavities with dimensions of up to several tens of meters within the boundaries of cultural heritage sites – the Holy Trinity Danilov Monastery in the city of Pereslavl-Zalessky (Yaroslavl Region), the Holy Dormition Pskov-Pechersky (Caves) Monastery (Pskov Region), and the Spaso-Kamenny Transfiguration Monastery (Vologda Region).
The team of authors has all the necessary capabilities to prepare methodological approaches and technical solutions for implementing the muonography method as applied to the study of the condition of oil and gas industry sites/facilities. The applicability of the method for geological studies was demonstrated in an experiment to investigate a rocky section of Mount Shandor-Tau (Republic of Tatarstan), inside which the presence of a layer of bituminous sandstone was recorded by means of muonography. New muonographic studies are planned at oil and gas and mining production facilities. Currently, an experiment is being conducted to investigate landslide processes on Mount Bytkha (Krasnodar Territory) with the prospect of constructing maps of densities and boundaries of rocks, active faults, and soil fracturing.
1. Cimmino L. Principles and perspectives of radiographic imaging with muons. Imaging. 2021;7(12):253. https://doi.org/10.3390/jimaging7120253
2. Tanaka H. K. M., Bozza C., Bross A. et al. Muography. Nature Reviews Methods Primers. 2023;(3):88. https://doi.org/10.1038/s43586-023-00270-7
3. Peña-Rodríguez J. Direct density estimation using muon radiography. Journal of Applied Physics. 2025;138(1):014901. https://doi.org/10.1063/5.0273292
4. Alexandrov A., Babaev P., Chernyavsky M. et al. Muography of geometrically complex cultural heritage sites: challenges and solutions on the example of searching for hidden anomalies on the ancient monastery territory in the Vologda Region. Physics of Atomic Nuclei. 2025;88:615–631. https://doi.org/10.1134/S106377882570053X
5. Khmelevskoy V. K., Gorbachev Yu. I., Kalinin A. V. et al. Geophysical methods of research. Petropavlovsk-Kamchatsky: KGPU Publ.; 2004. (In Russ.)
6. Aleksandrov A. B., Vladymyrov M. S., Galkin V. I. et al. Muon radiography method for fundamental and applied research. Uspekhi Fizicheskikh Nauk. 2017;(60):1277–1293. https://doi.org/10.3367/UFNe.2017.07.038188 (Orig. ver.: Aleksandrov A. B., Vladymyrov M. S., Galkin V. I. et al. Muon radiography method for fundamental and applied research. Uspekhi Fizicheskikh Nauk. 2017;(187):1375–1392. (In Russ.) https://doi.org/10.3367/UFNr.2017.07.038188)
7. Kremer J., Boezio M., Ambriola M. L. et al. Measurements of ground-level muons at two geomagnetic locations. Physical Review Letters. 1999;83:4241–4244. https://doi.org/10.1103/PhysRevLett.83.4241
8. Groom D. E., Mokhov N. V., Striganov S. I. Muon stopping power and range tables 10 MeV–100 TeV. Atomic Data and Nuclear Data Tables. 2001;78(2):183–356. https://doi.org/10.1006/adnd.2001.0861
9. Hong Y., Bonechi L., Borselli D. et al. Updates on MURAVES Project at Mt. Vesuvius. Journal of Applied Physics. 2025;138(6):064906. https://doi.org/10.1063/5.0275078
10. Rabaglia S., Cervelli A., Sioli M. A new detector for muography applied to glaciers monitoring. Journal of Applied Physics. 2025;138(7):074902. https://doi.org/10.1063/5.0272790
11. Surányi G., Varga D., Hamar G. et al. Underground muography measurements by the HUN-REN Wigner Research Centre for Physics. Journal of Applied Physics. 2025;138(6):064903. https://doi.org/10.1063/5.0273449
12. Nishiyama R., Tanaka Y., Okubo S. et al. Integrated processing of muon radiography and gravity anomaly data toward the realization of high-resolution 3-D density structural analysis of volcanoes: case study of Showa-Shinzan lava dome, Usu, Japan. Journal of Geophysical Research: Solid Earth. 2014;119(1):699–710. https://doi.org/10.1002/2013JB010234
13. Jourde K., Gibert D., Marteau J. Improvement of density models of geological structures by fusion of gravity data and cosmic muon radiographies. Geoscientific Instrumentation, Methods and Data Systems. 2015;(4):177–188. https://doi.org/10.5194/gi-4-177-2015
14. Rosas‐Carbajal M., Jourde K., Marteau J. et al. Three‐dimensional density structure of La Soufrière de Guadeloupe lava dome from simultaneous muon radiographies and gravity data. Geophysical Research Letters. 2017;44(13):6743–6751. https://doi.org/10.1002/2017GL074285
15. Le Gonidec Y., Rosas-Carbajal M., de Bremond d'Ars J. et al. Abrupt changes of hydrothermal activity in a lava dome detected by combined seismic and muon monitoring. Scientific Reports. 2019;9:3079. https://doi.org/10.1038/s41598-019-39606-3
16. Oláh L., Gallo G., Hamar G., et al. Muon imaging of volcanic conduit explains link between eruption frequency and ground deformation. Geophysical Research Letters. 2023;(50):e2022GL101170. https://doi.org/10.1029/2022GL101170
17. Alexandrov A., Anokhina A., Vasina S. et al. Principles of data processing of the muographic experiment in the cave complex of Pskovo-Pechersky Monastery. Physics of Atomic Nuclei. 2024;(87):718–731. https://doi.org/10.1134/S1063778824700649
18. Alimirzaev G. M., Fattakhov I. G., Nazimov N. A., et al., Application of muon tomography to investigate the structure and occurrence of bituminous sandstones. Exposition Oil Gas. 2026;(1):52–57. (In Russ.)
19. Perez R., Shanto S.A., Moosajee M., Cano S. High-resolution muography using a prototype portable muon telescope. Journal of Undergraduate Research in Physics and Astronomy. 2020;30(1):100006. https://doi.org/10.1063/10.0002046
20. Rao G., Bieberle A., Hampel U., Wagner M. Design studies on large muon trigger detectors using silicon photomultiplier devices. Journal of Applied Physics. 2025;138(11):114504. https://doi.org/10.1063/5.0288270
21. Sehgal R., Jha V. Optical multiplexing for channel reduction in scintillator based muon tomography system. Journal of Applied Physics. 2025;138(9):094901. https://doi.org/10.1063/5.0273319
22. Morishima K., Kuno M., Nishio A. et al. Discovery of a big void in Khufu’s Pyramid by observation of cosmic-ray muons. Nature. 2017;552:386–390. https://doi.org/10.1038/nature24647
23. Tioukov V., Alexandrov A., Bozza C. et al. First muography of Stromboli volcano. Scientific Reports. 2019;9:6695. https://doi.org/10.1038/s41598-019-43131-8
24. Morishima K., Kitagawa N., Nishio A. Development of nuclear emulsions for muography. Chap. 21. In: Oláh L., Tanaka H. K. M., Varga D. (Eds.) Muography: Exploring Earth's Subsurface with Elementary Particles. Geophysical Monograph Series. American Geophysical Union; 2022. https://doi.org/10.1002/9781119722748.ch21
25. Alexandrov A., Konovalova N., Okateva N. et al. Upgrade and new applications of the automated high-tech scanning facility PAVICOM for data processing of track detectors. Measurement. 2022;187:110244. https://doi.org/10.1016/j.measurement.2021.110244
26. Oláh L., Tanaka H.K.M., Varga D. (Eds.) Muography: Exploring Earth's Subsurface with Elementary Particles. Geophysical Monograph Series. American Geophysical Union; 2022. https://doi.org/10.1002/9781119722748
27. Oláh L., Tanaka H. K. M. Toward joint muography and ground deformation monitoring for volcanic unrest assessment. Journal of Applied Physics. 2025;138(6):060701. https://doi.org/10.1063/5.0275038
28. Zhang Z. X., Enqvist T., Holma M., Kuusiniemi P. Muography and its potential applications to mining and rock engineering. Rock Mechanics and Rock Engineering. 2020;53:4893–4907. https://doi.org/10.1007/s00603-020-02199-9
29. Liu G., Yao K., Niu F. et al. Deep investigation of muography in discovering geological structures in mineral exploration: a case study of Zaozigou gold mine. Geophysical Journal International. 2024;237(1):588–603. https://doi.org/10.1093/gji/ggae057
30. Braunroth T., Berner N., Rowold F. et al. Muon radiography to visualise individual fuel rods in sealed casks. EPJ Nuclear Sciences & Technologies. 2021;(7):12. https://doi.org/10.1051/epjn/2021010
31. Andreetto P., Aymanns K., Balling M., et al. Results on re-verification tests of spent fuel casks with muon tomography: MUTOMCA project. Journal of Applied Physics. 2025;138(12):124903. https://doi.org/10.1063/5.0272975
32. Borselli D., Ambrosino F., Andreetto P., et al. Muon imaging of a blast furnace: The European project BLEMAB. Journal of Applied Physics. 2025;(138):084902. https://doi.org/10.1063/5.0272969
33. Chalkova Yu. S., Cherepanov B. M. Landslide processes, their prediction and control. Polzunovskiy Vestnik. 2007;(1–2):80–89. (In Russ.)
34. Ezhov V. S., Khoroshilov V. S. Structure and classification of landslides. Interekspo GEO-Sibir. 2022;(6):54–61. (In Russ.) https://doi.org/10.33764/2618-981X-2022-6-54-61
35. Krakhina E. A., Ekzarian V. N. Features and assessment of landslide hazard in Moscow. Earth Sciences and Subsoil Use. 2025;48(1):77–87. (In Russ.) https://doi.org/10.21285/2686-9993-2025-48-1-77-87
36. Maeda K. On the zenithal distribution of extremely‐high‐energy cosmic‐ray muons in the atmosphere. Journal of Geophysical Research. 1964;(69):1725.
37. Vasina S. G., Starkov N. I., Polukhina N. G., Shchedrina T. V. Results of the test experiment on optimization of the number of emulsion layers in modern nuclear studies with track detectors. Bulletin of the Lebedev Physics Institute. 2022;49(12):429–435. (In Russ.)
Nina S. Konovalova – Cand. Sci. (Phys.-Math.), Leading Researcher, International Research Center for Ecology and Climate Change; Leading Researcher, Laboratory of Fundamental Particles
Sochi; Moscow
ResearcherID D-3882-2014
Scopus ID 7007009939
SPIN 1731-3687
Natalia M. Okateva – Cand. Sci. (Phys.-Math.), Leading Researcher, International Research Center for Ecology and Climate Change; Senior Researcher, Laboratory of Fundamental Particles
Sochi; Moscow
ResearcherID M-8565-2015
Scopus ID 56674684500
SPIN 3624-3124
Natalia G. Polukhina – Dr. Sci. (Phys.-Math.), Head of Scientific Group, International Research Center for Ecology and Climate Change; Head of Laboratory of Fundamental Particles; Leading Expert
Sochi; Moscow
Researcher ID AAH-7216-2019
Scopus ID 6603355151
SPIN 3412-3872
Daria M. Strekalina – Cand. Sci. (Chem.), Deputy Head of the Research Group, International Research Center for Ecology and Climate Change; Junior Researcher, Laboratory of Fundamental Particles
Sochi; Moscow
Researcher ID AAV-1487-2021
Scopus ID 56545836100
SPIN 9036-1374
Tatiana V. Shchedrina – Dr. Sci. (Phys.–Math.), Leading Researcher, International Research Center for Ecology and Climate Change; Senior Researcher, Laboratory of Fundamental Particles; Leading Expert
Sochi; Moscow
Researcher ID L-1233-2015
Scopus ID 13404667000
SPIN 3087-7412
Konovalova N.S., Okateva N.M., Polukhina N.G., Strekalina D.M., Shchedrina T.V. Application of muonography method in geology and geophysics: opportunities and prospects. Mining Science and Technology (Russia). https://doi.org/10.17073/2500-0632-2026-02-1113




Editor-in-Chief
Petrov V.L. Email this article (Login required)
Email the author (Login required)
Email this article (Login required)
Email the author (Login required) 119049, Moscow, Leninsky Prospect, 4, b. 1
The National University of Science and Technology MISIS (NUST MISIS)
Tel.: +7 (968) 848-61-24
E-mail: send@misis.ru





