Scroll to:
Assessing dust concentration at the workplace of a crushing and screening plant operator for special labor conditions evaluation
https://doi.org/10.17073/2500-0632-2024-03-235
Abstract
The mining industry is one of the key sectors of the Russian economy, supplying other industries with essential raw materials. However, this sector is characterized by harsh working conditions that may adversely affect workers' health. Exposure to harmful substances and significant physical workloads contribute to the development of occupational diseases. To ensure safety in production processes and protect the health of mining industry workers, it is necessary to conduct a special labor conditions assessment. This assessment allows for determining the level of harmfulness and hazard in workplaces, as well as developing measures to reduce the negative impact on workers' health. The purpose of this study is to assess dust concentration at the workplace of a crushing and screening plant operator as part of a special labor conditions evaluation. Dust concentration at the operator's workplace was measured using a standard gravimetric method. The testing was conducted in four stages and lasted 400 minutes, which is 83% of the total work shift duration. Data analysis revealed an exceedance of the permissible dust concentration by a factor of 1.28. The labor conditions class (subclass) was established as 3.1. It was found that the average dust concentrations varied by a factor of 3–4 across different testing stages due to the intensity and direction of air velocity at the production site. Based on the obtained data, dust concentrations at the workplace were predicted according to air velocity at the site, with an approximation accuracy of R2 = 0.95. It was determined that the maximum allowable air velocity at the site should not exceed 2.6 m/s. Using approximated data, it was forecasted that, in the absence of air movement, the dust concentration at the operator's workplace would remain at 0.5 mg/m³. To reduce dust concentration at the operator’s workplace, comprehensive measures to minimize dust generation at the crushing plant are necessary, including washing vehicle wheels, installing dust suppression systems, and replacing the open belt conveyor with a closed one. To prevent the development of occupational diseases, operators are advised to use personal respiratory, skin, and eye protection throughout the shift.
Keywords
For citations:
Korol E.A., Degaev E.N., Konyukhov D.S. Assessing dust concentration at the workplace of a crushing and screening plant operator for special labor conditions evaluation. Mining Science and Technology (Russia). 2024;9(4):395-405. https://doi.org/10.17073/2500-0632-2024-03-235
Assessing dust concentration at the workplace of a crushing and screening plant operator for special labor conditions evaluation
Introduction
According to data from the Federal Labor and Employment Service of the Russian Federation1, the mining industry remains the most hazardous sector of economic activity [1, 2]. This is primarily due to the specifics of production processes and the challenging climatic and geographical conditions. In 2023, crushed stone production exceeded 221 million tons, representing a 24.5% increase compared to 2017 (Fig. 1). Crushed stone is one of the primary materials used in construction and the production of building materials. A decline in extraction and production rates is not expected in the coming years due to the implementation of various large-scale federal projects. Consequently, the industry will need to expand its capacity and create more jobs [3, 4].
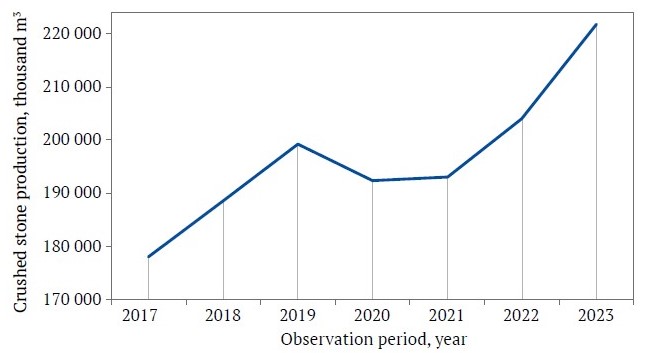
Fig. 1. Crushed stone production dynamics in Russia from 2017 to 2023
Crushed stone production involves a range of occupational risks and health hazards for workers [4, 5]. Various professions operate within crushing and screening plant, each with specific health risks. For example, dump truck and loader drivers are exposed to noise and vibration, which can lead to hearing loss and vibration disease. However, the most hazardous factor in crushed stone production is dust, which consists of 60% or more silicon dioxide (SiO₂). Crusher and screen operators work in high-dust environments, which can lead to silicosis and other lung diseases [6, 7].
Research in this area primarily focuses on the effects of silica dust on human health and on measuring dust concentration across the entire plant or quarry at various distances from pollution sources. This data is used for modeling and developing dust reduction methods. For instance, Kuznetsov V. S. and Sulamanidze L. F. note that during crushing and screening plant operations, dust concentration at the edge of the sanitary protection zone exceeds the permissible exposure limit (PEL) by 5–10 times [8]. Francis Ahadzi Dzifa investigated the effects of silica dust on quarry workers' health and reported their symptoms, recommending the use of personal protective equipment (PPE) for respiratory protection and eyewear [9]. In his studies, Frederick Anlimma highlights a rise in silicosis cases in several countries and questions the effectiveness of dust control methods in preventing exposure to inhalable crystalline silica [10]. Zhichao Liu proposed an optimized dust reduction method for a crushing station based on modeling results and simulated the dust diffusion pattern associated with this method [11].
Since 2014, Russia has implemented a special labor conditions assessment (SLCA), regulated by federal legislation2 and aimed at identifying and evaluating hazardous and harmful production factors at individual workplaces, as well as developing measures to improve working conditions and prevent occupational diseases.
The objective of this study is to determine the dust concentration at the workplace of a crushing and screening plant operator within the framework of the SLCA.
To achieve this objective, the following tasks were set:
- conduct tests and determine the average shift dust concentration in the operator's working zone;
- identify factors affecting dust concentration at the operator's workplace;
- forecast dust concentration at the workplace based on approximated data under various wind speeds;
- evaluate the adequacy and accuracy of the obtained results;
- establish the labor conditions class (subclass) for the operator;
- develop recommendations to reduce dust concentration at the operator's workplace and improve working conditions.
The novelty of this study lies in its comprehensive approach to assessing dust concentration at the workplace of a crushing and screening plant operator, taking into account industry-specific factors and the effect of wind speed on dust concentration.
The scientific significance of the study is in the approximation of data for predicting dust concentration at the operator's workplace depending on wind speed at the production site.
The practical value of the study lies in forecasting dust concentration in the operator's workplace air based on wind speed at the production site and in developing recommendations to reduce dust concentration at the crushing and screening plant.
1 Ministry of Labor and Social Protection of the Russian Federation. Results of Labor Conditions and Occupational Safety Monitoring in the Russian Federation, 2022. Moscow, 2022.
2 Federal Law No. 426-FZ dated December 28, 2013, "On Special Labor Conditions Assessment."
Research methods
To measure dust concentration in the air at the workplace of a crushing and screening plant operator, an aspiration method was applied. This method involves passing a specified volume of air through special filters, after which the dust mass is measured and the concentration calculated1.
The mass concentration of total dust in the air, Kd, for each individual test is determined by the formula:

were Kd is the dust concentration in the air, mg/m³; m0 is the mass of the clean filter, mg; mn is the mass of the filter with deposited dust particles, mg; and V20 s the air volume, adjusted to standard conditions, dm³.

where Vt is the volume of air passed through the filter, dm³; P is atmospheric pressure, kPa; and T is the air temperature at the workplace, °C.
If the measurement times vary, the time-weighted average concentration is calculated by:

where t1, t2, … tn is the measurement times, min.
The average shift dust concentration at the workplace is calculated by:

where Kash1, Kash2, … Kashn are the time-weighted average dust concentrations for each technological operation, mg/m³; Tash1, Tash2, … are the durations of each technological operation, min; and ∑Т is the total duration of the work shift, min.
To assess data distribution, the median Me and the geometric standard deviation σg are determined:
Me = eln Me, (5)
where

The final result is recorded as:

where K is the arithmetic mean of the measurement results n, mg/m³, and δ is the relative error margins, %.
To assess the accuracy and reliability of the calculations, a probabilistic data processing method may also be used. In this case, the geometric standard deviation is calculated as follows:

where K84 and K16 are the concentration values corresponding to 84% and 16% probability levels, respectively, mg/m³.
The average shift dust concentration is then determined by:

where
ln Kash = ln Me + 0.5(ln σg)2. (11)
3 Methodology for measuring mass dust concentration by gravimetric method for special labor conditions assessment. MI APFD –18.01.2018; MUK 4.1.2468–09 Measurement of mass dust concentrations in workplace air in mining and non-metallic industry enterprises.
Research results
Dust measurements were conducted as part of the special labor conditions assessment procedure [12, 13] at a crushing and screening plant located in the Moscow region. The operator's workplace is housed in a standalone, container-type facility three meters above ground level, equipped with climate control for air conditioning.
Dust generation occurs throughout the entire production cycle at the crushing and screening plant (Fig. 2). The main factors contributing to dust generation at the site are as follows:
- movement of heavy-duty vehicles;
- loading of raw materials into the receiving hopper;
- operation of the crusher;
- operation of the vibrating screen;
- piling of crushed stone.
The most intensive dust generation at the study site occurs when sorted crushed stone is piled. As it freely falls from the conveyor belt, lighter dust particles detach from the surface of the crushed stone due to air resistance. The greater the drop height, the more kinetic energy the crushed stone acquires, which transfers to dust particles, causing them to move and collide. This results in an increase in the number of collisions and particle fragmentation, generating a larger volume of dust. Another significant factor contributing to high dust concentration at the production site is air velocity, which not only intensifies dust movement but also lifts settled particles from stockpiles and equipment surfaces, thereby increasing dust concentration in the air. Therefore, in this study, air velocity measurements were taken and analyzed for their impact on dust concentration at the operator’s workplace, in addition to the standard methodology.
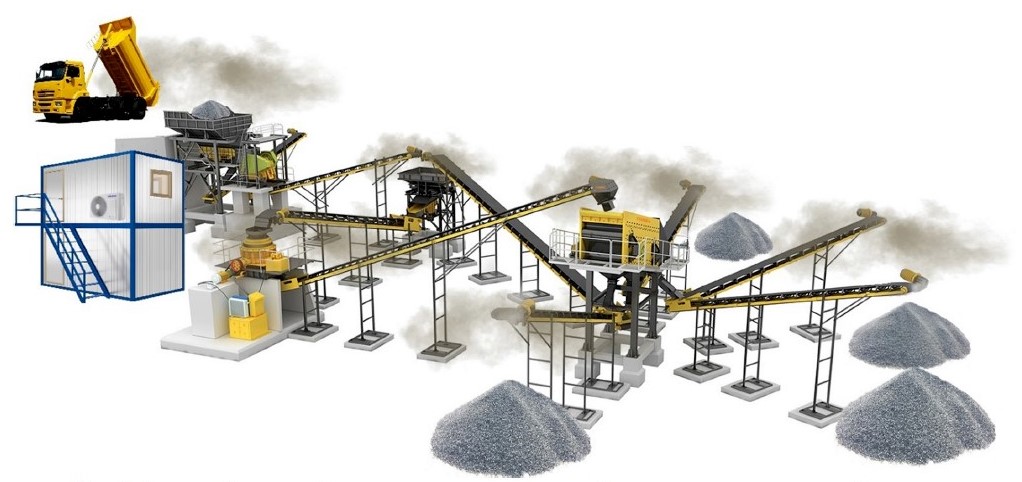
Fig. 2. Schematic of the crushing and screening plant illustrating the main sources of dust generation
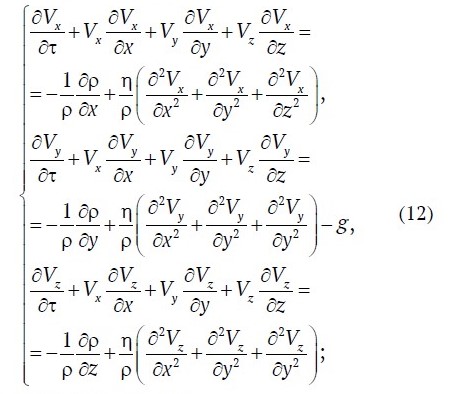
As a mathematical model describing dust emissions, a system of equations can be used, which includes the following [14]:
- Navier–Stokes equation:
- continuity equation:

- Mendeleev–Clapeyron equation:

- heat conduction equation:

- equation for dust concentration variation:

where x, y, z are the Cartesian coordinates; τ is the time; V is the air velocity; P is the air pressure; ρ is the material density; Т is the air temperature; M is the molar volume ; R is the universal gas constant (8.31 J/mol·K); η is the dynamic viscosity; g is the gravitational acceleration; λ(T) is the thermal conductivity coefficient of the material; С(T) is the specific heat capacity of the material; С is the concentration of dust emissions; Vc is the dust settling velocity (0.04 m/s); Fc is the power of the dust source [14].
During the testing, the production process was conditionally divided into four stages of two hours each, evenly distributed throughout the shift. The measurement time for each individual sample was 25 minutes. The total measurement time was 400 minutes, covering 83% of the work shift. Sampling was conducted using AFA filters (analytical aerosol filters) with a PU-type aspirator. During testing, the wind was blowing toward the building housing the operator's workplace. Table 1 presents the measurement results and their subsequent processing according to the standard calculation methodology.
Table 1
Air sampling results for calculating average shift dust concentrations
| Stage No | Stage duration T, min | Filter mass m0, mg | Filter mass mn, mg | Airflow rate, L/min | Atmospheric pressure, kPa | Measurement time t, min | Air temperature at workplace, °C | Air velocity V, m/s | Dust concentration values K, mg/m³ | Arithmetic mean concentration for stage К0l, mg/m3 | Average shift dust concentration Ксс, mg/m3 | Median Me | Geometric standard deviation σg |
| I | 120 | 62574.6 | 62577.0 | 20 | 102.0 | 25 | 21.4 | 1 | 4.79 | 3.70 | 7.7 | 6.22 | 1.92 |
62020.2 | 62022.7 | 25 | 21.5 | 2 | 4.99 | ||||||||
62828.1 | 62829.1 | 25 | 21.9 | 1 | 2.00 | ||||||||
62532.8 | 62534.3 | 25 | 22.0 | 1 | 3.00 | ||||||||
| II | 120 | 64731.1 | 64737.2 | 102.2 | 25 | 22.3 | 4 | 12.19 | 14.21 | ||||
60150.5 | 60159.4 | 25 | 22.5 | 5 | 17.80 | ||||||||
60741.8 | 60750.1 | 25 | 22.7 | 5 | 16.61 | ||||||||
61799.2 | 61804.3 | 25 | 23.5 | 4 | 10.23 | ||||||||
| III | 120 | 63384.4 | 63389.2 | 102.6 | 25 | 24.8 | 4 | 9.64 | 9.41 | ||||
61474.8 | 61479.0 | 25 | 25.4 | 4 | 8.45 | ||||||||
61696.4 | 61702.2 | 25 | 25.9 | 4 | 11.69 | ||||||||
61495.3 | 61499.2 | 25 | 26.1 | 3 | 7.86 | ||||||||
| IV | 120 | 60473.5 | 60475.6 | 102.8 | 25 | 25.5 | 2 | 4.22 | 3.41 | ||||
63826.8 | 63829.0 | 25 | 25.2 | 1 | 4.41 | ||||||||
63638.6 | 63640.0 | 25 | 24.7 | 1 | 2.80 | ||||||||
63937.4 | 63938.6 | 25 | 24.4 | 1 | 2.40 |
The results indicate a stable dust concentration in the air at the workplace, as the geometric standard deviation σg < 3. However, it should be noted that the average concentrations for each stage differ by a factor of 3–4, due to variations in air velocity and direction at the production site. An increase in air velocity up to 5 m/s was observed from 10:00 to 13:30, corresponding to the peak dust concentration levels at the workplace (Fig. 3).
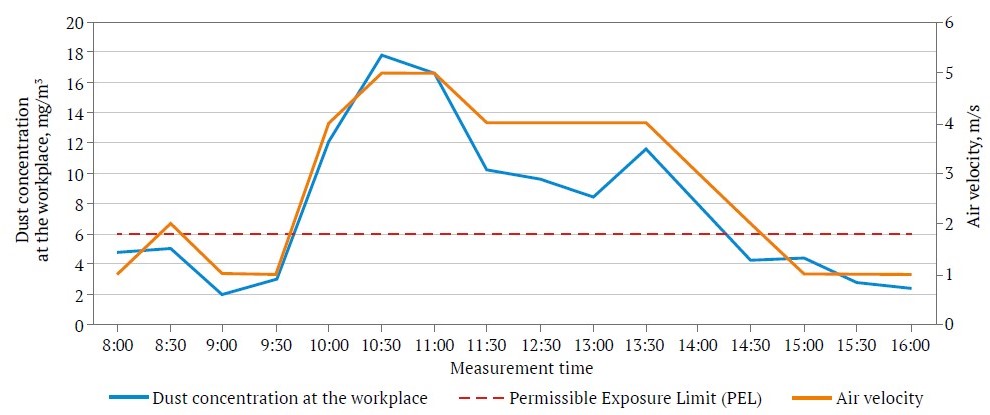
Fig. 3. Variation in dust concentration at the workplace across different testing stages
Based on the data shown in Fig. 4, it is possible to predict the dust concentration Kdw at the workplace depending on air velocity V at the production site, with an approximation accuracy of R2 = 0.95:
Kdw = 0.2185V3 – 1.1571V2 + 3.6493V + 0.4968. (17)
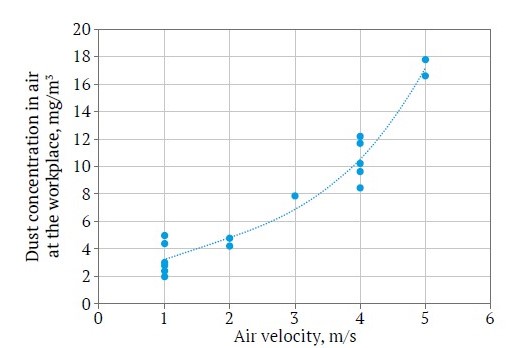
Fig. 4. Dependence of dust concentration at the workplace on air velocity
Using the graph presented in Fig. 4, we determine the permissible air velocity at the study site:
Vperm = 2.6 m/s.
To establish the relationship between dust generation and various factors—such as technological equipment, vehicle movement, loading of the receiving hopper, and the height of free-falling crushed stone—we calculate the dust concentration using formula (17) with V = 0 m/s:
Kperm.0 = 0.5 mg/m3.
A probabilistic method was applied to assess the accuracy of measurements [15, 16]. This method provides a comprehensive view of all dust concentrations in the air within the workplace area using a logarithmic probability grid. To investigate the conformity of the data to a normal distribution, a frequency histogram method was employed as a graphical approach to data distribution (Fig. 5).
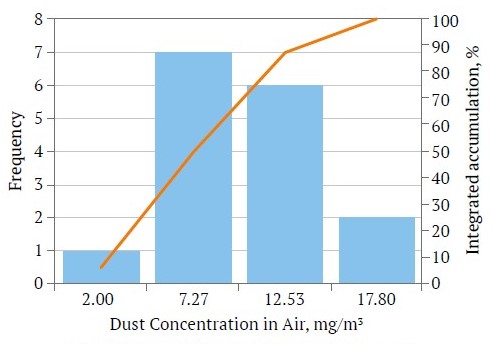
Fig. 5. Normal distribution graph for n = 16
The resulting histogram has a bell-shaped form, resembling a normal curve, which suggests that the data follow a normal distribution [17]. The data for probabilistic analysis are provided in Table 2, where individual dust concentration measurements have been ranked in ascending order with accumulated frequencies determined.
Table 2
Calculation of average shift dust concentration in the workplace area using the probabilistic method
No. | Ranked dust concentration values К n Ascending Order, mg/m³ | Measurement time Т, min | Sampling duration as percentage of total testing time, % | Cumulative frequency, % | Average shift dust concentration Ксс, mg/m3 | Median Me | Geometric standard deviation σg |
1 | 2.00 | 25 | 6.25 | 6.25 | 7.6 | 6.00 | 1.94 |
2 | 2.40 | 25 | 6.25 | 12.50 | |||
3 | 2.80 | 25 | 6.25 | 18.75 | |||
4 | 3.00 | 25 | 6.25 | 25.00 | |||
5 | 4.22 | 25 | 6.25 | 31.25 | |||
6 | 4.41 | 25 | 6.25 | 37.50 | |||
7 | 4.79 | 25 | 6.25 | 43.75 | |||
8 | 4.99 | 25 | 6.25 | 50.00 | |||
9 | 7.86 | 25 | 6.25 | 56.25 | |||
10 | 8.45 | 25 | 6.25 | 62.50 | |||
11 | 9.64 | 25 | 6.25 | 68.75 | |||
12 | 10.23 | 25 | 6.25 | 75.00 | |||
13 | 11.69 | 25 | 6.25 | 81.25 | |||
14 | 12.19 | 25 | 6.25 | 87.50 | |||
15 | 16.61 | 25 | 6.25 | 93.75 | |||
16 | 17.80 | 25 | 6.25 | 100.00 |
The probability grid (Fig. 6) shows the concentration results with corresponding cumulative frequencies, along with an integrated line drawn through the points. From this line, the following were determined: the median Ме = 6 and concentration values for 84% and 16% (K84 = 12.1 mg/m3; K16 = 3.2 mg/m3).
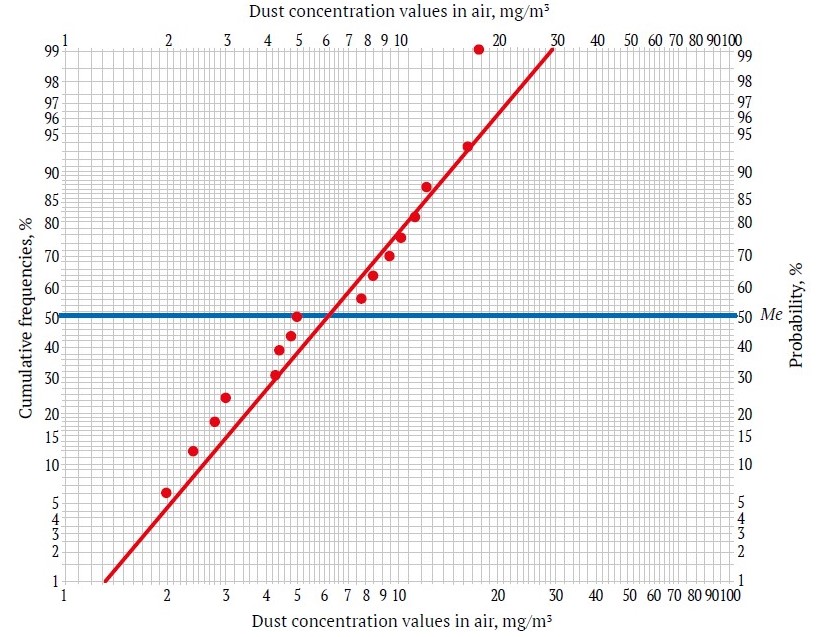
Fig. 6. Probability coordination grid
To test the assumption of the model's conformity to a normal distribution, the Shapiro–Wilk test will be applied:
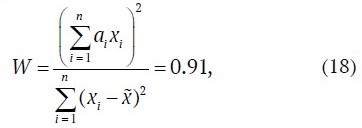
where n is the number of observations; xi is the values of the ordered sample; and ai are tabulated coefficients depending on the number of trials.
Table 3 presents the intermediate calculations for the Shapiro–Wilk test.
Table 3
Results of intermediate calculations for the Shapiro–Wilk Test
| x | хi | (хi −x )2 | ai | ai · хi |
| 7.69 | 2 | 32.38 | 0.51 | 1.02 |
2.4 | 27.98 | 0.33 | 0.79 | |
2.8 | 23.91 | 0.25 | 0.70 | |
3 | 22.00 | 0.19 | 0.57 | |
4.22 | 12.04 | 0.15 | 0.63 | |
4.41 | 10.76 | 0.10 | 0.44 | |
4.79 | 8.41 | 0.06 | 0.29 | |
4.99 | 7.29 | 0.02 | 0.10 | |
7.86 | 0.03 | −0.02 | −0.16 | |
8.45 | 0.58 | −0.06 | −0.51 | |
9.64 | 3.80 | −0.10 | −0.96 | |
10.23 | 6.45 | −0.15 | −1.53 | |
11.69 | 16.00 | −0.19 | −2.22 | |
12.19 | 20.25 | −0.25 | −3.05 | |
16.61 | 79.57 | −0.33 | −5.48 | |
17.8 | 102.21 | −0.51 | −9.08 | |
| Sum | – | 373.66 | – | −18.45 |
The calculated W statistic exceeds the tabulated value Wt = 0.887 at a significance level of α = 0.05, which confirms, providing 95% confidence that the data distribution conforms to a normal distribution.
The average shift dust concentration obtained using the probabilistic method was 7.6 mg/m³. A deviation of 0.1 mg/m³ demonstrates the accuracy and reliability of the tests, as the confidence interval, according to equation (8), is ± 1.85 mg/m³. The calculated value is therefore accepted as the final result:
Kash = 7.7 ± 1.85 mg/m3.
The summary results for determining the labor conditions class (subclass) are presented in Table 4. Dust from crushed stone production is classified as an aerosol primarily with fibrogenic potential, which corresponds to hazard class 3. The obtained result exceeds the permissible exposure limit (PEL) by a factor of 1.28, which falls under labor conditions class 3.1 (subclass) and necessitates the establishment of a harmful exposure allowance.
Table 4
Results of labor conditions assessment for the workplace
Occupation / position | PEL* or dust in workplace air, mg/m3 | Hazard class | Health impact | Average daily dust concentration in workplace air, mg/m3 | Deviation from PEL | Labor Conditions Class (Subclass)** |
Crushing and screening operator | 6 | 3 | Aerosols primarily with fibrogenic potential | 7.7 | 1.28 | 3.1 |
Source: * GN 2.2.5.3532–18 Permissible Exposure Limits (PEL) for harmful substances in workplace air; ** GOST Р 54578–2011 Workplace air. Aerosols primarily with fibrogenic potential. General principles for hygienic control and impact assessment.
Conclusion
The results of the dust concentration assessment at the workplace of a crushing and screening plant operator indicate an exceedance of the permissible exposure limit (PEL) by a factor of 1.28, corresponding to labor conditions class 3.1 (subclass). The average daily dust concentration at the operator’s workplace is 7.7 mg/m³; however, it should be noted that the average concentrations across different stages vary by a factor of 3–4, influenced by the intensity and direction of air velocity at the production site.
Based on the obtained data, dust concentrations Kdw at the workplace were predicted as a function of air velocity V at the production site, with an approximation accuracy of R2 = 0.95. It was determined that the maximum allowable air velocity at the site should not exceed 2.6 m/s.
When PEL values for dust concentration in workplace air are exceeded, legislation1 requires the employer to halt production and take measures to reduce airborne dust to the lowest possible level.
To reduce dust concentration at the operator’s workplace, comprehensive dust control measures are needed at the crushing and screening plant, including [18–22]:
- washing the wheels of vehicles upon entering and exiting the production site;
- installing stationary or mobile dust suppression systems that use water spray nozzles at low and medium pressure to create a mist;
- replacing the open belt conveyor with a closed conveyor system.
Additionally, it is recommended to replace the filters in the climate control equipment with carbon filters to enhance air purification.
Using approximated data, it was forecasted that, in the absence of air movement at the production site, the dust concentration at the operator's workplace would remain at 0.5 mg/m³. Inhaling crystalline silica can lead to the formation of nodules of connective tissue in the lungs and scarring around the particles. The body's natural defense cells cannot remove this toxic dust, leading to chronic inflammation and potential lung cell damage. Some individuals may experience allergic reactions, such as skin rashes and/or itching, when in contact with the dust. To prevent the development of occupational diseases, operators are advised to use personal protective equipment (PPE) for respiratory, skin, and eye protection throughout the shift.
The presented results can be used to predict dust concentrations at the workplaces of operators at other crushing and screening plants, taking into account individual empirical data collected at each site.
1 Labor Code of the Russian Federation, dated December 30, 2001, No. 197-FZ
References
1. Nikulin A., Nikulina A. Y. Assessment of occupational health and safety effectiveness at a mining company. Ecology, Environment and Conservation. 2017;23(1);351–335.
2. Korol E. A., Degaev E. N., Konyukhov D. S. Labor safety in laying of underground utilities. Mining Informational and Analytical Bulletin. 2024; (2):129–139. (In Russ.) https://10.25018/0236_1493_2024_2_0_129
3. Lapshin N. S. Vinogradov I. P., Dzurich N. S. Analysis of development trend in the market of nonmetallic constructional materials in the Russian Federation. Mining Informational and Analytical Bulletin. 2018:(7):205–211. (In Russ.) https://10.25018/0236-1493-2018-7-0-205-211
4. Butkevich G. R. Industry of non-metallic building materials. Prospection. Building Materials. 2019;(11):32–36. (In Russ.) https://10.31659/0585-430X-2019-776-11-32-36
5. Balovtsev S. V. Monitoring of aerological risks of accidents in coal mines. Mining Science and Technology (Russia). 2023;8(4):350–359. https://doi.org/10.17073/2500-0632-2023-10-163
6. Rastanina N. K., Kolobanov K. A. Impact of technogenic dust pollution from the closed mining enterprise in the Amur Region on the ecosphere and human health. Mining Science and Technology (Russia). 2021;6(1):16–22. https://doi.org/10.17073/2500-0632-2021-1-16-22
7. Rathebe P. Occupational exposure to silicon dioxide and prevalence of chronic respiratory symptoms in the cement manufacturing industries: Journal of Public Health Research. 2023;12(4):1–10. https://10.1177/22799036231204316.
8. Sulamanidze L. F. Kuznetsov L. F. Assessment of dust pollution of the atmosphere during the processing of non-metallic materials. In: Step into the future: theoretical and applied research of modern science: materials of the XVII Youth International Scientific and practical conference of students, postgraduates and young scientists. St. Petersburg: Lulu Press; 2019. Pp. 38–41. (In Russ.)
9. Ahadzi D. F., Afitiri A. R., Ekumah B. et al. Self-reported disease symptoms of stone quarry workers exposed to silica dust in Ghana. Health Science Reports. 2020;3(4):189. https://10.1002/hsr2.189
10. Anlimah F., Gopaldasani, V., MacPhail C. et al. A systematic review of the effectiveness of dust control measures adopted to reduce workplace exposure. Environmental Science and Pollution Research. 2023:30(19);54407–54428. https://doi.org/10.1007/s11356-023-26321-w
11. Liu Z., Ao Z., Zhou W. et al. Research on the physical and chemical characteristics of dust in open pit coal mine crushing stations and closed dust reduction methods. Sustainability. 2023;15(16):12202. https://doi.org/10.3390/su151612202
12. Pakhomova L., Oleynik P. Selection and evaluation of work place certification parameters (special assessment of labor conditions). Construction Production. 2019:(1);49–52. (In Russ.) https://10.54950/26585340_2019_1_49
13. Zanina I. A., Makeeva L. A., Zhabaeva M. U. et al. Identification of the causes of injuries in the coal industry and measures to reduce risks (using the example of Bogatyr Komir LLP). Science & Reality. 2023;4(16):90–95. (In Russ.)
14. Matyushinets T. V., Jatskevich Yu. V., Chychko A. N. Mathematical modeling of the distribution of dust emissions in the spatial structure of the workshop. Foundry Production and Metallurgy. 2018;(4):107–113. (In Russ.) https://10.21122/1683-6065-2018-4-107-113
15. Verevkyna O. I. On the hybrid method of forecasting the risks on railway transport based on the general logical-and-probabilistic method. Proceedings of Petersburg Transport University. 2017;14(4):615–627.
16. Kuligin D., Shkoliar F. Influence of the probabilistic method to summarize loads on the reliability and material consumption of building structures. Architecture and Engineering. 2023:8(2):49–57. https://10.23968/2500-0055-2023-8-2-49-57.
17. Duplyakin V. M. Nuances of identification for normal distribution. Vestnik of Samara University. Economics and Мanagement. 2020:11(3):176–183. https://10.18287/2542-0461-2020-11-3-176-183
18. Zeng L.-M., Yang X.-Y., Wang L.-H. et al. Determination of weight concentration of free silicon dioxide for dust using X-ray diffraction technique and Rietveld refinement method. Chinese Journal of Analytical Chemistry. 2008;(36):599–603.
19. Jing D., Ma J., Dong Z. et al. Research on factors affecting the spread of dust pollution in conveyor belt workshop and research on wet dust reduction technology. PLoS One. 2024;19(2):e0299328. https://doi.org/10.1371/journal.pone.0299328
20. Jing D., Ma J., Zhang T. et al. Numerical simulation of the fine kinetics of dust reduction using high-speed aerosols. PLoS One. 2023;18(12):e0286101. https://doi.org/10.1371/journal.pone.0286101
21. Bajracharya N., Magar P., Karki S. et al. Occupational health and safety issues in the construction industry in south asia: a systematic review and recommendations for improvement. Journal of Multidisciplinary Research Advancements. 2023;1(1):27–31. https://doi.org/10.3126/jomra.v1i1.55101
22. Klimov I. Yu. Analysis of Soft Skills-Based Approach Effectiveness in Advanced Training Program for Mining Company. Mining Science and Technology (Russia). 2020;5(1):56-68. (In Russ.) https://doi.org/10.17073/2500-0632-2020-1-56-68
About the Authors
E. A. KorolRussian Federation
Elena A. Korol – Dr. Sci. (Eng.), Professor, Head of the Department of Housing and Communal Services
Moscow
Scopus ID 57197844794, ResearcherID C-2635-2019
E. N. Degaev
Russian Federation
Evgeniy N. Degaev – Cand. Sci. (Eng.), Associate Professor, Associate Professor of the Department of Housing and Communal Complex
Moscow
Scopus ID 57195225439, ResearcherID S-1854-2018
D. S. Konyukhov
Russian Federation
Dmitry S. Konyukhov – Dr. Sci. (Eng.)
Moscow
Scopus ID 6507981388
Review
For citations:
Korol E.A., Degaev E.N., Konyukhov D.S. Assessing dust concentration at the workplace of a crushing and screening plant operator for special labor conditions evaluation. Mining Science and Technology (Russia). 2024;9(4):395-405. https://doi.org/10.17073/2500-0632-2024-03-235


