Scroll to:
Determination of deformation modulus and characterization of anisotropic behavior of blocky rock masses
https://doi.org/10.17073/2500-0632-2023-08-143
Abstract
The anisotropy in the deformational behavior of blocky rock masses has been comprehensively investigated. The uniaxial deformation modulus was selected as the key parameter. This modulus is generally anisotropic and depends on the loading direction, as well as on the properties of the intact rock, joints, and joint setting. Representative volumes of blocky rock masses were numerically simulated using the discrete element method and were loaded uniaxially in various directions. Subsequently, the failure mode and the deformation modulus were studied for different loading directions and various relative joint settings. A new nonlinear, stress- dependent stiffness matrix for joints was introduced, incorporating the surface conditions of the joints in terms of the Joint Roughness Coefficient (JRC) and the properties of the intact rock materials in terms of the Uniaxial Compressive Strength (UCS). The results of the assessments are presented in the form of rose diagrams, showing variations in the deformation modulus of the blocky rock mass that depend on the joint’s JRC, the intact rock’s UCS, and the structure of the rock mass in term of the relative joint angle. Also, the expected degree of anisotropy for various joint surface conditions and uniaxial compressive strengths of intact rock were introduced. In the Geological Strength Index (GSI) table, results are classified such that assigning a value to the JRC for each class of joint surface conditions allows for the corresponding deformation modulus and degree of anisotropy. According to this chart, it is deduced that the effect of joint roughness on the deformation modulus of blocky rock masses is greater than that of the intact rock UCS. The results support the hypothesis that a blocky rock mass has a critical strain that is independent of the loading angle (θ) and the orientation of the third joint set (α).
Keywords
For citations:
Ahrami O., Javaheri Koupaei H., Ahangari K. Determination of deformation modulus and characterization of anisotropic behavior of blocky rock masses. Mining Science and Technology (Russia). 2024;9(2):116-133. https://doi.org/10.17073/2500-0632-2023-08-143
Determination of deformation modulus and characterization of anisotropic behavior of blocky rock masses
Highlights
- New nonlinear stress – dependent relations for both normal and shear stiffness of joints have been introduced
- Blocky rock masses are classified based on their joint surface condition and the strength of the intact rock.
- Results are organized in manner analogous to the GSI chart, allowing for the determination of the range of deformation modulus and degree of anisotropy for a specified blocky rock mass with an evaluated GSI.
- The degree of anisotropy in the deformation modulus of blocky rock masses, defined as the ratio of the maximum deformation modulus to the minimum, was determined to be between 1.6 and 2.3, with an
average value of 1.88.
Equation Symbols
σn: Normal stress;
σc: Uniaxial Compressive Strength;
σci: Uniaxial Compressive Strength of intact rock;
σcm: Uniaxial Compressive Strength of rock mass;
τn: Shear stress;
τf: Peak shear stress;
τult: Ultimate shear stress;
ϕ: Friction angle of intact rock;
ϕj: Friction angle of joint;
ϕb: Base friction angle of joint;
a: Empirical constant;
C: Cohesion parameter of intact rock;
Cj: Cohesion parameter of joint;
K: Bulk modulus of intact rock;
G: Shear modulus of intact rock;
T: Tensile strength of intact rock;
Tj: Tensile strength of joint;
Ei: Intact rock elastic modulus;
Em: Deformation modulus of rock mass;
Emax: Maximum deformation modulus of rock mass;
Emin: Minimum deformation modulus of rock mass;
GSI: Geological strength index;
JRC: Joint roughness coefficient;
JCS: Compressive strength of the joint wall;
UCS: Uniaxial compressive strength;
Kn: Joint normal stiffness;
Ks: Joint shear stiffness;
Ksn: Coupling effects of the shear and normal behavior of the joint;
Kns: Coupling effects of the normal and shear behavior of the joint;
Kni: Initial joint normal stiffness;
Ksi: Initial joint shear stiffness;
Rf: Failure ratio;
RE: Degree of anisotropy deformation;
Un: Normal join relative displacement;
Us: Shear joint relative displacement;
Unc: Maximum joint vertical displacement;
U: Joint aperture at the beginning of loading;
UsPeak: Shear displacement at peak strength;
D: Disturbance factor.
Introduction
The deformation modulus of rock mass is a fundamental parameter in the geomechanics of tunnels, mining, and other geotechnical rock-supported facilities. The mechanical properties of a rock mass, seen as a fractured medium, are determined by the intact rock, the pattern of relative joint-sets, the geometrical arrangement of the joints, and their mechanical properties. Joint sets, acting as planar discontinuities, confer scale and direction-dependent mechanical properties. Each joint set introduces anisotropy in the direction of its normal vector. When a rock mass is heavily fractured, the individually imposed anisotropy by the joints in any direction can considered uniformly distributed, resulting in an isotropic rock mass. Otherwise, even in dimensions larger than the representative elementary volume (REV), where the rock mass can be treated as a continuum, its directional dependence persists.
For rock masses with simple joint settings, analytical relations, such as those proposed by Singh [1], Gerrard [2], Oda [3] and Amadei and Savage [4], are available to evaluate the deformation modulus. An example of such type of relations is the three-dimensional equivalent continuous model presented by Kulhawy [5] for a rock mass with three orthogonal joint sets that displays orthotropic behavior. However, it is impossible to find a closed-form solution for the deformation modulus of rock masses with numerous joint sets or when considering more advanced constitutive behavior for intact rock and joints. It is noteworthy that empirical methods commonly used in rock engineering to evaluate rock mass deformability, such as those presented by Serafim & Pereira [6], Gokceoglu et al. [7], Hoek & Diederichs [8], overlook the effect of rock mass anisotropy and there is a lack of a mathematical platform for creating a behavioral model.
In experimental methods, as the mechanical properties of the rock mass are scale-dependent, the scales of rock samples and test probes seldom correspond proportionally to the actual rock masses. Heuze [9] concluded that the rock mass deformation modulus measured in the field ranges widely between 20 and 60% of the intact rock modulus measured in the laboratory. In-situ tests are costly, time-consuming, and challenging to interpret due to the presence of undefined joints and uncertain boundary conditions. They are often used cautiously as a representative of the extent of the affected rock mass. Furthermore, multiple tests in various directions are necessary to characterize the inherent anisotropy of the rock mass.
Numerical simulations of rock masses as fractured discontinue generally employ two methodologies. One is the continuum approach, where the impact of discontinuities is implicitly considered through equivalent mechanical properties, as per Singh [1], Agharazi et al. [10]. The other involves numerical solution techniques such as discrete element, finite element, or finite difference methods, in which discontinuities are explicitly simulated. The discrete element method (DEM), introduced by Cundall [11] and further developed by subsequent researchers [12, 13], is highly regarded for its ability to describe the geometric configurations and constitutive relations of joints and intact rock. Many studies on the mechanical behavior of rock masses have employed discrete element method [14–16].
The present study investigates the anisotropic deformation modulus of blocky rock masses formed by three intersecting joint sets, including two orthogonal sets. This was achieved through discrete element simulations of representative volumes of blocky rock masses.
The critical factor influencing the deformational behavior of a rock mass is the stiffness of its fractures and discontinuities. The stiffness of planar discontinuities, expressed through the normal (Kn) and shear (Ks) components, is crucial for evaluating the stiffness of the rock masses. Definitions that closely reflect actual conditions improve the accuracy of the calculated rock mass deformation modulus. Therefore, efficient relationships that accurately represent nonlinear joint behavior are essential for calculating the rock mass deformation modulus. To this end, a newly inferred nonlinear stress-dependent stiffness matrix for joints has been introduced for the simulations. This matrix accounts for the real nonlinear behavior of joints through their basic parameters, eliminating the need for multiple tests. This study is unique in that directly incorporates the fundamental joint parameters into the calculation of rock mass modulus, enhancing the precision and applicability of the results.
This study aims to present a realistic portrayal of the anisotropic behavior of blocky rock masses by combining numerical simulation with a mathematically-empirical relationship for joint stiffness in a practical manner. It addresses the deformation modulus, failure mechanism, and post-failure behavior for different loading directions, along with summarizing the degree of anisotropy. The deformation moduli are depicted through rose diagrams, illustrating the variability of the blocky rock mass deformation modulus in various directions as a function of the rock mass’s intrinsic parameters along. These parameters include the joint’s JRC, the intact rock’s UCS, and the structure of the rock mass in terms of relative joint angle. These diagrams allow for the estimation of the blocky rock mass deformation modulus in different directions without relying on laboratory and in-situ tests or empirical relationships. Furthermore, by consolidating the analysis results into the GSI table, the data were categorized such that assigning a JRC value to each class of joint surface conditions enables the determination of the corresponding deformation modulus and degree of anisotropy for GSI values.
1. Modeling strategy
To examine the state of anisotropy in blocky rock masses, representative volumes were simulated using the discrete element method (via 3DEC software, Itasca 20131) and subjected to uniaxial loading in various directions.
For different relative joint settings – representing various blocky rock masses – the failure modes and the deformation moduli were ascertained for different loading directions. The modeling procedure includes: a) defining the geometric configuration of the blocky rock masses; b) applying uniaxial loading to the selected rock mass in various directions; c) specifying the mechanical constitutive behavior of joints and intact rock in a parametric manner; and d) identifying a representative volume for the rock masses. These steps are elaborated on in the subsequent subsections.
1Itasca Consulting Group Inc., 2013. 3DEC 5.00, User’s Guide, Itasca Consulting Group, Inc.
1.1. Geometric setting of studied blocky rock masses
The term 'blocky rock mass' usually refers to a rock mass that encompasses three joint sets [17]. In this study, we consider blocky rock masses that include two orthogonal joint sets intersected by a third set, as shown in Fig. 1. In Fig. 1, the third joint set forms an angle (α) with the second joint set, and its strike is perpendicular to the strike of the joint set 1. This study examines rock masses formed by values of α = 5°, 15°, 30°, 45°, 60°, 75° and 90°.
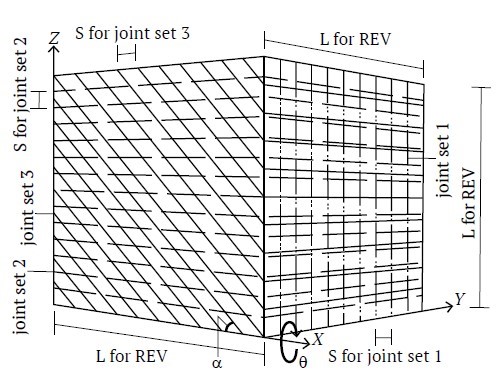
Fig. 1. A blocky rock mass with two orthogonal joint sets intersected by a third joint set forming an angle (α)
1.2. Loading scheme
To evaluate the anisotropic behavior of the models, a representative volume element of the mass was subjected to uniaxial loading in different directions. This load is applied perpendicular to a plane with a strike parallel to the ‘X’ axis, deviating from the ‘–Z’ axis by an angle θ.
Fig. 2 depicts the directions of uniaxial loadings on a blocky rock mass with α = 45º. As another example, Fig. 3, a illustrates a model of a blocky rock mass with α = 90° and θ = 0, and Fig. 3, b shows a model of a blocky rock mass with α = 90° and θ = 45º.
The 3DEC models are made as cubes with axes aligned with the global coordinates of the software environment, and uniaxial load is consistently applied in the direction of the global vertical axis. To load the mass at an angle θ for each set of joints, the joint planes are rotated around the global x axis by angle θ, as shown in Fig. 1.
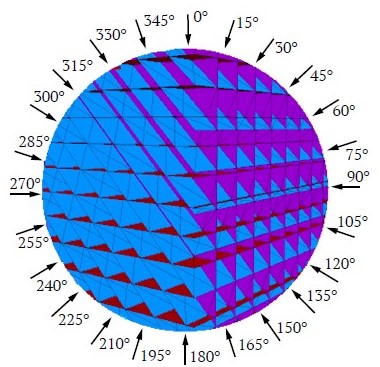
Fig. 2. Directions of Uniaxial Loadings on a blocky rock mass with α = 45 degrees
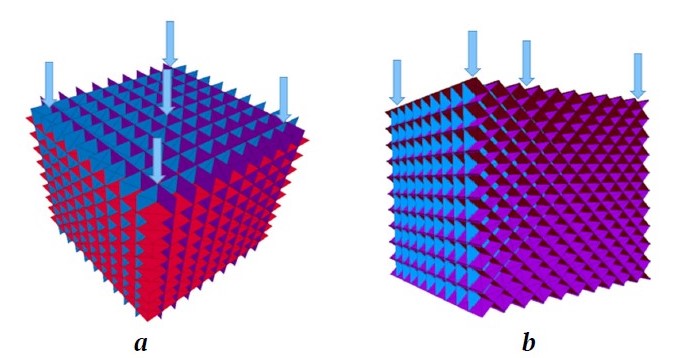
Fig. 3. A blocky rock mass with: а – α = 90° and loading angle θ = 0; b – α = 90° and loading angle by θ = 45°
1.3. Mechanical properties of joint
A general constitutive equation for the deformation of joints can be expressed as:
where σn is the normal stress, τn is the shear stress, Un is the normal relative displacement, and Us is the shear relative displacement of the joint. Kn and Ks are the normal and shear stiffnesses of the joint, respectively, and Ksn and Kns are the coupling effects of the shear and normal behaviors of the joint, which have been neglected in this study. To account for a realistic behavior of joint stiffness in the models, new nonlinear stress-dependent expressions for the diagonal components of the joint stiffness matrix are introduced in the following subsections. These expressions define the stiffness matrix components as a function of the normal stress to the joint (σn) the joint surface condition in terms of the Joint Roughness Coefficient (JRC), and the intact rock material in terms of the Uniaxial Compressive Strength of intact rock (σci).
1.3.1. Normal stiffness
The normal behavior of a joint can be described by the hyperbolic model proposed by Goodman et al. [18] and Bandis et al. [19] as:
where Un is the joint vertical displacement, Unc is the maximum joint vertical displacement, and “a” is an empirical constant. Fig. 4 shows a typical normal behavior of joints. From the definition of Kn and Eq. (2):
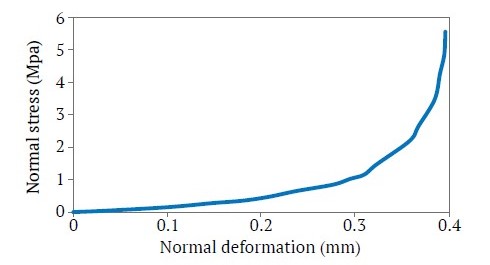
Fig. 4. Typical normal stress-deformation behavior of joints
Thus, the initial joint normal stiffness Kni at the onset of loading, when Un = 0, is:
By solving Eq. (4) for “a” in terms of Unc and Kni, and substituting in Eq. (2) for Unc and then into Eq. (3), Kn becomes:
Eq. (5) expresses the normal joint stiffness in a specified state of stress and deformation relative to its initial value, Kni which can be evaluated as follow:
Bandis et al. [19] proposed the initial normal stiffness of joints as:
Kni = −7.15 + 1.75JRC + 0.02 [JCS/U], (6)
Here, JRC is the Joint Roughness Coefficient of the joint surface and JCS is the compressive strength of the joint wall expressed in MPa, which can be equated with the compressive strength of the intact rock (σci). The joint aperture U, mm, at the beginning of loading can be estimated by Bandis et al. [19]:
U = JRC [0.04σci/JCS − 0.02]. (7)
By substituting U from Eq. (7) into Eq. (6), an expression for estimating Kni is derived.
1.3.2. Shear stiffness
The relationship between the relative shear displacement (Us) and shear stress (τ) can be described by a hyperbolic function [19–21] as:
τ = [1/(KsiUs) + Rf/τf]−1, (8)
where Ksi is the initial shear stiffness, τf is the shear strength of the joint, Rf is the failure ratio (τf /τult), and τult is the ultimate shear stress. Consequently:
Ks = (dτ)/(dUs) = Ksi [1+(RfKsiUs)/τf]−2, (9)
Us = [Ksi/τ −(RfKsi)/τf ]−1. (10)
At the shear strength of a joint, using τ = τf and peak Us = Uspeak from Eq. (10), we get:
Following Barton and Choubey [22], the shear displacement at peak strength along a joint is considered to be 0.01 times the length of the joint or fault block; hence, the relative shear displacement, Uspeak is 0.01. From Eq. (11):
Substituting Eqs. (10) and (12) into Eq. (9), we obtain:
According to Bandis et al. [19]:
Ksi = (−17.19 + 3.86JRC)(σn)0.783. (14)
and following [23–25]:
1.4. Mechanical properties of intact rock
The intact rock is assumed to behave as an isotropic elastic-perfectly plastic material, and the Mohr-Coulomb criterion was adopted as the yield or failure model. The relationship between the elastic modulus, Ei and the uniaxial compressive strength, σci, of intact rock was selected from the relationships proposed by Deere & Miller [26]. They proposed correlations between σci and Schmidt hammer rebound number (Rn(l)), and between Ei and Rn(l) as:
Ei = 0.6005ρRn(l) − 2.0276, GPa, (17)
which yields:
Ei = 69.023 log(0.145σci) − 13.07, GPa, (18)
where σci is in MPa. Eqs. (16) and (17) have been proposed based on experimental results from 28 lithological units and 3 types of rocks [26]. Poisons’ ratio is selected as 0.25.
The cohesion parameter of intact rock, C, is determined as [27]:
C= 0.16σci. (19)
For the friction angle of intact rock, a value is selected as representative for each group variation of σci as presented in Table 1, based on typical values of φ for various rocks in [28] and Barton & Choubey [22].
Table 1
Correlation selection between uniaxial compressive strength and friction angle for intact rock
| σci, MPa | φ, degree |
| σci < 50 | 25 |
| 50 < σci < 100 | 30 |
| 100 < σci < 250 | 35 |
1.5. Representative Elementary Volume of the rock masses
It is recognized that the mechanical behavior of rock masses with a systematic pattern of joints is scale-dependent. Depending on the relative block size (ratio of block size to a characteristic size of the rock mass, e.g. S / L in Fig. 1), rock mass behavior can range from that of intact rock to an asymptotic value at a large scale where the rock mass may be considered a continuum. Cuba [29] suggested that a certain scale, known as the “Representative Elementary Volume” (REV), can be chosen above which the characteristics of the domain remain basically constant. Empirically based relations can be employed to estimating this scale. Schultz [30] recommended a scale of 5 to 10 times the block size or fracture spacing (relative block size = 0.2 to 0.1).
For a cubic volume containing three uniform joint sets with spacing S and dimension L, the minimum relative dimension (L/S) of the REV can be determined through successive analyses of the cube’s uniaxial behavior. The chosen volume consists of two orthogonal joint sets intersected by a third set at α = 45°, as illustrated in Fig. 1. The results for peak uniaxial strength and uniaxial secant stiffness corresponding to 50 percent of the peak strength E50, are presented in Fig. 5. From this figure, L/S = 10 was selected as the REV scale.
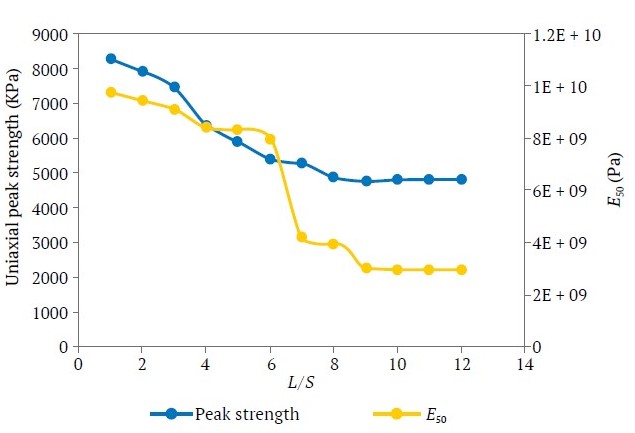
Fig. 5. Variation in uniaxial peak strength and E50 for a blocky rock mass (α = 45° in Fig. 1) with L/S ratio (intact rock shear modulus G = 4GP, intact rock bulk modulus K = 6.66 GPa; φ = 25, v = 0,25, c = 2.4 GPa)
2. Validation of the modeling strategy
The validation of the implemented modeling procedure has been conducted through a series of comparisons between existing results and numerical modeling predictions. This includes comparison for: a) simulated variation of uniaxial compressive strength UCS of a rock mass with a single joint set with closed-form solution results (Section 2.1), b) predicted mode of failure of jointed rock masses with experimental modeling results (Section 2.2), and c) predicted anisotropic modulus of rock with a single joint set with experimental modeling results (Section 2.3).
2.1. Simulation of UCS of a rock mass with a single set of joints
Jaeger proposed a closed-form solution for predicting the variation of uniaxial compressive strength of a rock mass with a single joint set in various directions [31]. Fig. 6 compares the UCS from the numerical model of a cylindrical specimen with a single joint set to the solution proposed by Jaeger et al. [31]. The angle of the joints relative to the vertical axis varies from 0° to 90°. In the numerical solution, a cylindrical rock mass sample with a diameter of 2 m and a length of 4 m was loaded to failure. The UCS values are compared in Fig. 6. As shown in Fig. 6, the results closely align with the solution by Jaeger et al. [31]. Details of the intact rock and the joints are provided in the caption of Fig. 6.
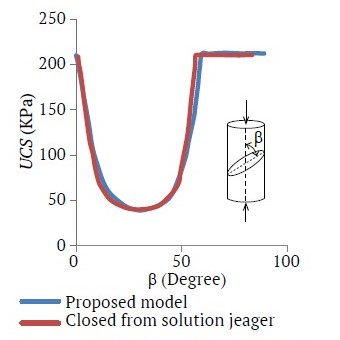
Fig. 6. UCS variation in a rock mass with a single joint set and varied joint inclination. Intact rock parameters: G = 4.28 GPa; K = 1.75 GPa; φ = 40; T = 200 kPa; Joint parameters: cj = 10 kPa; φj = 30; Tj = 20 kPa; Kn = 15 GPa/m; Ks = 12 GPa/m
2.2. Simulation of experiments on failure modes of jointed rocks
Yang et al. (1998) [32] performed a series of physical model tests to investigate the failure mode and anisotropy of jointed rocks. These models included simulated rock specimens (composed by cement and sand) with one or two non-orthogonal joint sets, as presented in Table 2. Table 2 also provides a comparison between the failure states observed in test results reported by Yang et al. (1998) [32] and the outcomes of numerical simulations of these models, which were found to be consistent.
Table 2
Comparison of failure modes in physical and numerical models
| Proposed model | Test result | Rock mass with one joint set |
dip = 0 dip = 90 | Intact rock failure Intact rock failure | Intact rock failure Intact rock failure |
| Proposed model | Test result | Rock mass with two joint sets |
dip = 0/90 dip = 60/−60 (60/120) dip = 40/−40 (40/140) | Intact rock failure Joint sliding Mixed failure (joint sliding + intact rock) | Intact rock failure Joint sliding Mixed failure |
2.3. Simulation of experiments on deformation modulus of jointed rocks
Fig. 7 present a comparison between the experimental deformation modulus from Yang et al. [32] and the results of numerical simulation for a rock mass with a single joint set. The consistency between experimental results and numerical simulation is evident.
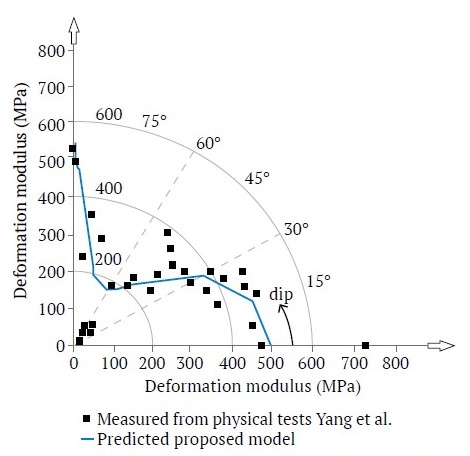
Fig. 7. Experimental vs. numerical simulation deformation modulus comparison from Yang et al. [32] for a rock mass with a single joint set. Fundamental material properties: G = 1.913 GPa; K = 2.448 GPa; JCS = 7.63 MPa; φ = 31; σt = 1.05 MPa; v = 0.19; U.W. = 1.05 g/cm3; σc = 7.63 MPa
3. Results of Simulations
3.1. Anisotropy in rock mass stress-strain behavior and failure mechanism
When a rock mass is subjected to uniaxial loading, the possible failure mechanisms include intact rock failure, failure due to sliding on the joints, and a combination of these two modes. In the analyses, stress-strain curves and modes of failures have been examined. The mechanisms of failure and the post-failure behavior for each loading direction are summarized in Tables 3 and 4.
Table 3
Failure mechanisms for the blocky rock masses shown in Fig. 1
| θ | α | ||||||
| 5 | 15 | 30 | 45 | 60 | 75 | 90 | |
| 0° | IRF + JS | IRF + JS | IRF + JS | JS | JS | IRF + JS | IRF |
| 15° | IRF + JS | IRF + JS | JS | JS | IRF + JS | IRF + JS | IRF + JS |
| 30° | JS | JS | JS | JS | JS | JS | JS |
| 45° | JS | JS | JS | JS | JS | JS | JS |
| 60° | JS | JS | JS | JS | JS | JS | JS |
| 75° | IRF + JS | IRF + JS | JS | JS | JS | IRF + JS | IRF + JS |
| 90° | IRF + JS | IRF + JS | IRF + JS | JS | JS | IRF + JS | IRF |
Note: IRF: Intact rock failure; JS: Joint sliding
Table 4
Post-failure behavior of blocky rock masses shown in Fig. 1
| θ | α | ||||||
| 5 | 15 | 30 | 45 | 60 | 75 | 90 | |
| 0° | P & B | P & B | S & B | P & S | P & S | P & B | P & B |
| 15° | P & B | P & S | S | S | S & B | S & B | S & B |
| 30° | P & S | S | S | S | P & S | P & S | S |
| 45° | P & S | S | S | S | S | S | P & S |
| 60° | P & S | S | P & S | S | S | S | S |
| 75° | P & B | P & B | S | S | S | P & B | P & B |
| 90° | P & B | P & B | S & B | P & S | S & B | P & B | P & B |
Note: P: Perfect plastic; S: Softening; B: Brittle
For instance, in the case of poor rock (0 < JRC < 4 and σci < 25 MPa) by selecting σci = 15 and JRC = 2 as mean values, Fig. 8 shows how axial stress-strain curves vary with the relative uniaxial loading direction α. σci represents the UCS of the intact rock. For each curve, the mode of failure has also been indicated in the Figure.
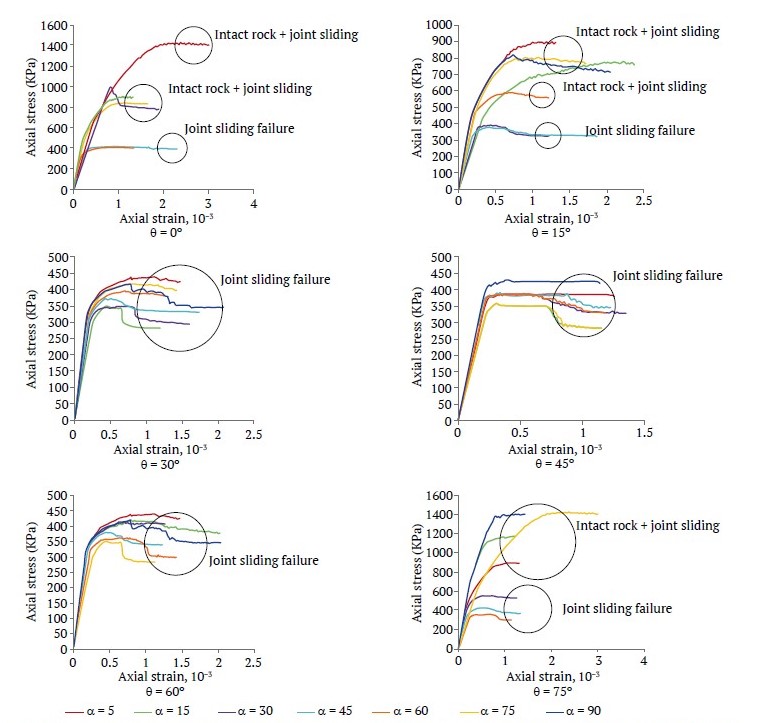
Fig. 8. Stress-strain curve comparison for different directions of third joint set (α) at different loading angles (θ) for poor quality blocky rock mass (JRC = 2 and σci = 15 MPa)
When the loading direction is perpendicular to or parallel with the planes of the joints, (θ = 0 or θ = 90) and (α = 0 or α = 90), failure of the blocky rock mass occurs due to the failure in the rock material. In other cases, failure of the rock mass occurs due to the sliding on the joints or as a combination of sliding on the joints and failure of the intact rock. When the direction of loading varies from 15 to 75° (15 ≤ θ ≤75), failure in the blocky rock mass occurs due to the sliding on the joints. In this case, the uniaxial strength of the rock mass, σcm, is between 0.35 to 0.45MPa (σcm < 0,03σci). When θ varies from 0° to 15° or from 75° to 90° (0 < θ < 15 or 75 < θ < 90), failure occurs as a combination of the failure of the intact rock and sliding on the joints. In this case, σcm varies from 0.8 to 1.4MPa (σcm < 0.1σci). For the case of fair-quality blocky rock mass (4 < JRC < 8 and 50 < σci <100), when the failure occurs due to the sliding on the joints, σcm < 0.05σci; and when failure occurs as a combination of failure of the intact rock and sliding on the joints, σcm < 0.16σci. For good-quality blocky rock masses (8 < JRC < 12 and 100 < σci < 250), when failure occurs due to the sliding on the joints, σcm < 0.14σci and when it occurs as a combination of the failure of the intact rock and sliding on the joints, σcm < 0.4σci. Fig. 9 shows a subset of these results for brevity.
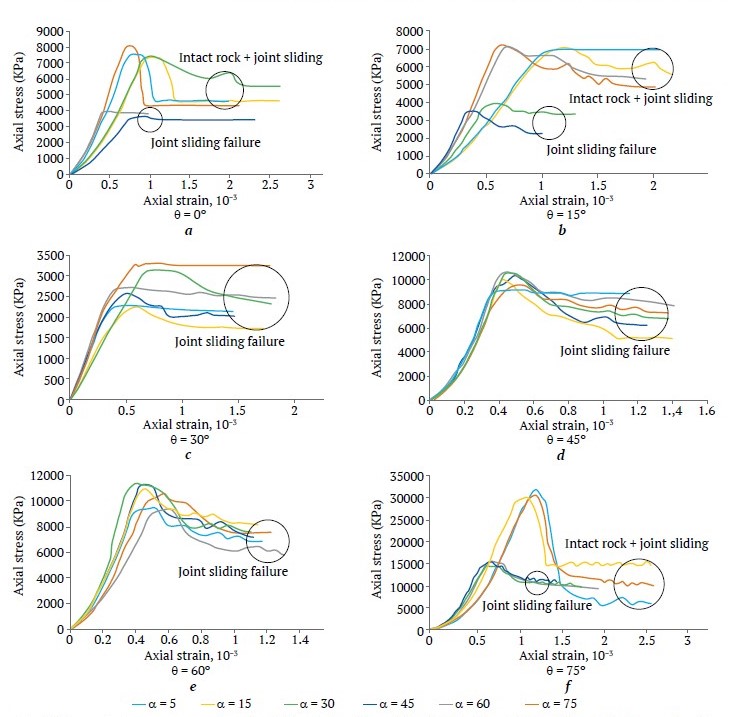
Fig. 9. Stress-strain curve comparison for different directions of the third joint set (α) at different loading angles (θ): a, b, c, for fair quality blocky rock mass (JRC = 8 and σci = 80 MPa); d, e, f, for good quality blocky rock mass (JRC = 12 and σci =150 MPa)
It is important to note that when failure in the blocky rock mass occurs due to sliding on the joints (at θ = 30, θ = 45, and θ = 60), the yield strain ranges from 0.2 to 0.4 and is independent of the loading angle (θ) and the direction of the third joint set (α). When samples undergo softening after peak stress, phenomena such as block rotation within the mass and the formation of a zigzag pattern on the fracture surface are observed.
3.2. Anisotropy in deformation modulus of blocky rock masses
The deformation modulus is considered a function of the characteristics of the joints and intact rock, as well as the direction. Blocky rock masses were classified based on the joints condition by JRC as (0 < JRC < 4, 4 < JRC < 8, 8 < JRC < 12, 12 < JRC < 16, 16 < JRC < 20) and the UCS of the intact rock as (σci < 25 MPa, 25 < σci < 50 MPa, 50 < σci < 100 MPa, 100 < σci < 250 MPa). The deformation modulus for each group is calculated for different α directions. Results of these calculations are presented in a polar coordinate system introduced in Fig. 10.
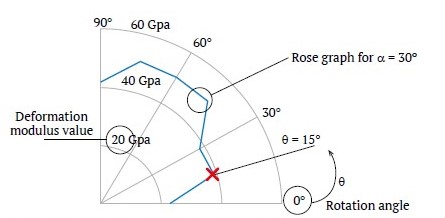
Fig. 10. Polar coordinate representation of blocky rock mass deformation modulus as a function of angle θ (curve shown for 16 < JRC < 20, 50 < σci < 100 MPa, and α = 30°)
In this system, angle θ (defined in Fig. 1) is measured in the positive trigonometric direction from 0° to 90°, and the value of the deformation modulus is indicated in the radial direction from the center. In these charts, the deformation modulus is expressed in GPa. In Fig. 10, the curve represents the range 16 < JRC < 20 and 50 < σci <100 MPa at α = 30°. Each point on this curve, which attributes a modulus value E to θ in 5° increments, is calculated as follows:
- for a specific value of θ;
- for σci ranging from 50 to 100MPa in 5 steps (60, 70, 80, 90, 100MPa);
- for JRC from 16 to 20 in 4 steps (17, 18, 19, 20);
- an E is calculated for each pair of JRC and σci, and their mean value is attributed to the θ value.
Figs. 11 to 14 display the results. In these figures, each curve corresponds to a specific value of α. From these figures, by knowing the rock mass structure (α), joint conditions (based on JRC), and intact rock properties (represented by σci), the deformation modulus of the rock mass can be extracted from the curves for different loading directions. For example, in Fig. 10, for a rock mass with two orthogonal joint sets and a third joint set at α = 30, if the condition of joint is very good, (16 < JRC < 20), and 50 < σci < 100 MPa, the deformation modulus at θ = 15° is 39 GPa.
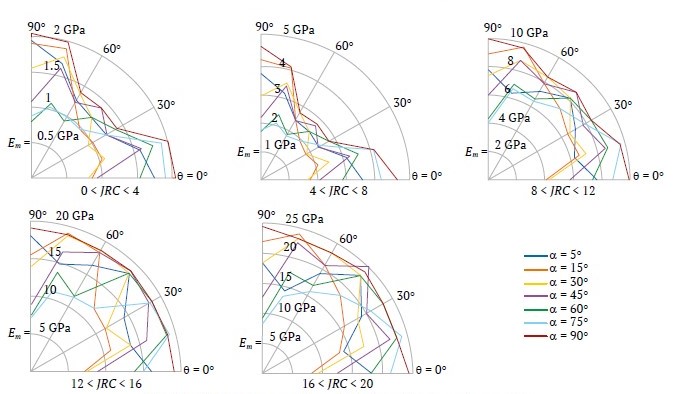
Fig. 11. Deformation modulus of blocky rock masses for σci < 25
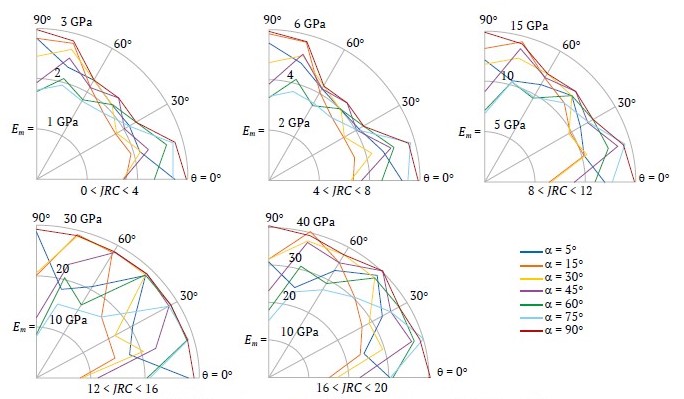
Fig. 12. Deformation modulus of blocky rock masses for 25 < σci < 50
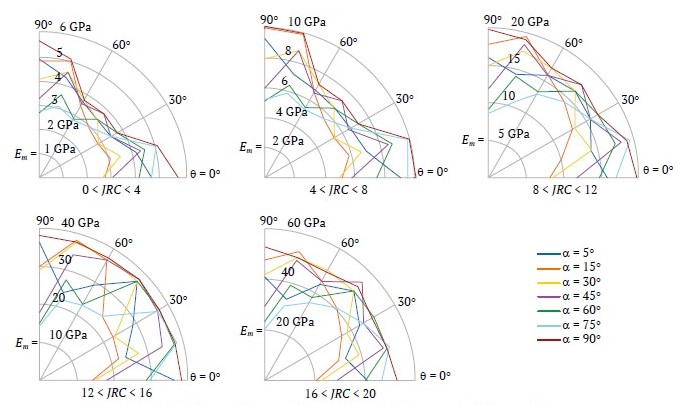
Fig. 13. Deformation modulus of blocky rock masses for 50 < σci <100
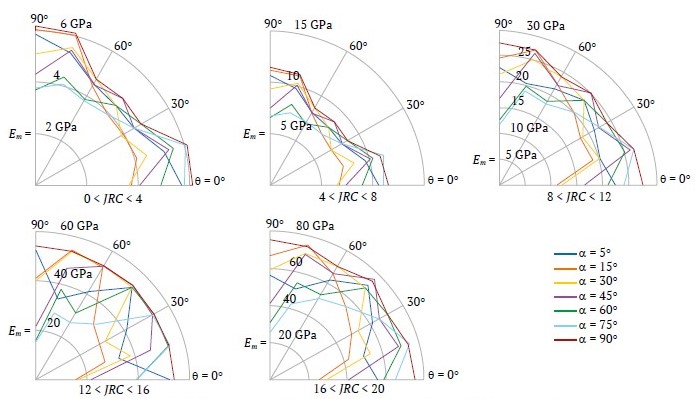
Fig. 14. Deformation modulus of blocky rock masses for 100 < σci < 250
3.3. Indexing anisotropy in blocky rock masses
An anisotropy index (RE), defined as the ratio of the maximum deformation modulus (Emax) to the minimum deformation modulus (Emin), can be expressed as:
RE has been calculated for each curve in Figs. 11 to 14, and the results are presented in Fig. 15. For example, in Fig. 15, a, the first column shows that RE = 1.64 corresponds to the anisotropy of a blocky rock mass with α = 5°, 0 < JRC < 4 and σci < 25 MPa. This is the mean value of RE’s calculated for pairs of (JRC, σci) as JRC = 1, 2, 3, 4 and σci = 5, 10, 15, 20, 25 MPa. For each column, the values are displayed as bars above it. The magnitude of anisotropy index for a blocky rock mass can be expected to be between 1.6 and 2.3 (1.6 ≤ RE ≤ 2.3), with an average value of 1.88.
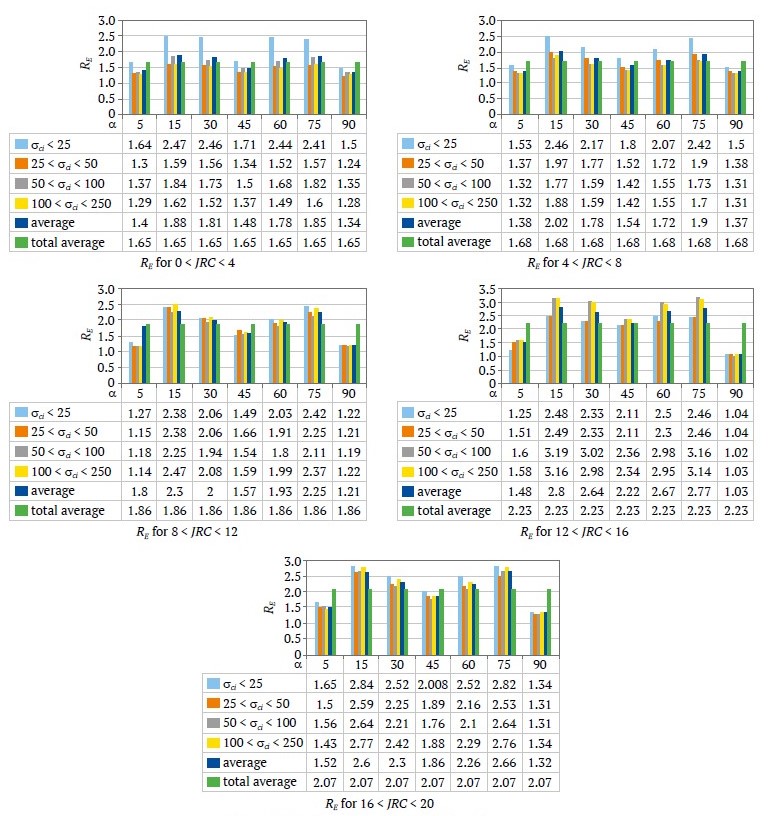
Fig. 15. Anisotropy index, RE, in blocky rock masses
3.4. Comparison of results with empirical relationships
For further evaluation of the results presented in Figs. 11 to 14, the range of variation of the deformation modulus for each class of blocky rock masses is presented and compared with corresponding results from empirical relationships in Tables 5. In this table, the classification of blocky rock masses is based on the surface condition of the joints, similar to the GSI table by Hoek [17]. For each class of rock mass (with specified range of JRC), Em values calculated for different ranges of σci, were compared, and maximum and minimum values are presented in the table.
Table 5 assigns range of GSI values for each class of rock mass based of JRC values, in analogy with the GSI table by Hoek [17].
A comparison in Table 5 shows that the relation proposed by Hoek and Diederichs [8] with a disturbance factor (D) of 0 (“D” is zero for an undisturbed state, 0.5 for partially disturbed, and 1for fully disturbed states) shows the best match with the numerical simulation results. This is graphically presented in Fig. 16. The modulus values obtained from the relation proposed by Serafim & Pereira [6] are higher than those in the current study, but the values from Gokceoglu et al. [7] are lower compared to the results of the current simulations. Also, the deformation modules from Sonmez [36] and Carvalho [35] are high when compared to the results of the current research for blocky rock mass with weak joints. However, for strong joints, the modulus values are lower, indicating a very high safety factor for weak joints and a very low one for strong joints.
Table 5
Comparative evaluation of deformation modulus for blocky rock masses (Em) using empirical formulas and numerical simulation
| Joint surface condition | Poor | Very poor | Very good | Good | Fair | Reference |
| JRC | 0 < <4 | 4 < < 8 | 8 < < 12 | 12 < < 16 | 16 < < 20 | |
| Deformation modulus (GPa) | ||||||
| Numerical simulation | 0.79–6.2 | 1.6–11.5 | 4–27.5 | 7–54.2 | 8–75.5 | – |
| GSI | 25–45 | 35–55 | 45–65 | 55–75 | 65–85 | – |
| 10(RMR – 10)/40 | 3.16–10 | 5.6–17.7 | 10–31.6 | 17.7–56.2 | 31.6–100 | [6] |
| 2RMR – 100 | – | – | – | 0–60 | 40–80 | [33] |
| 0.1451e0.654GSI | 0.744–2.752 | 1.43–5.29 | 2.75–10.18 | 5.29–19.58 | 10.18–37.66 | [7] |
| 0.0736e0.755RMR | 0.7–3.2 | 1.5–6.8 | 3.2–14.5 | 6.8–30.9 | 4.5–65.7 | [7] |
| 0.33e0.064GSI | 1.63–5.87 | 3.1–11.14 | 5.87–21.14 | 11.14–40.1 | 21.14–76.04 | [34] |
| EiS1/4 | 6.22–10.85 | 8.21–14.32 | 10.85–18.91 | 14.32–24.96 | 18.91–32.96 | [35] |
| Ei(Sα)0,4 | 8.61–14.49 | 11.37–18.38 | 14.49–22.95 | 18.38–28.76 | 22.95–35.85 | [36] |
| 1.05–6.13 | 2.56-13.96 | 6.13–28.73 | 13.96–50 | 28.73–71.42 | [8] | |
| 0.254–1.54 | 0.629–3.71 | 1.54–8.59 | 3.71–18.23 | 8.59–33.27 | [8] | |
| 0.055–0.334 | 0.135–0.823 | 0.334–1.96 | 0.823–4.68 | 1.96–10.21 | [8] | |
GSI = RMR – 5, s = exp [(GSI – 100)/9]
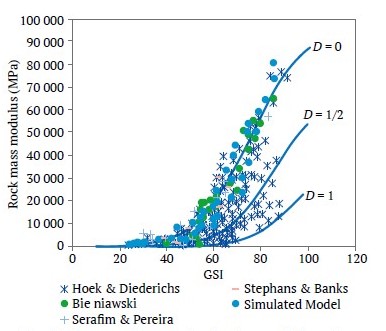
Fig. 16. Comparative analysis of rock mass deformation modulus from empirical formulas versus numerical simulation
3.5. Deformation modulus and anisotropy index of blocky rock masses as a function of GSI
The results of the calculation of deformation modulus, Em, and the anisotropy index, RE, of blocky rock masses can be summarized in a GSI table as shown in Fig. 17. The JRC values relate to the surface quality of the joints in this table.
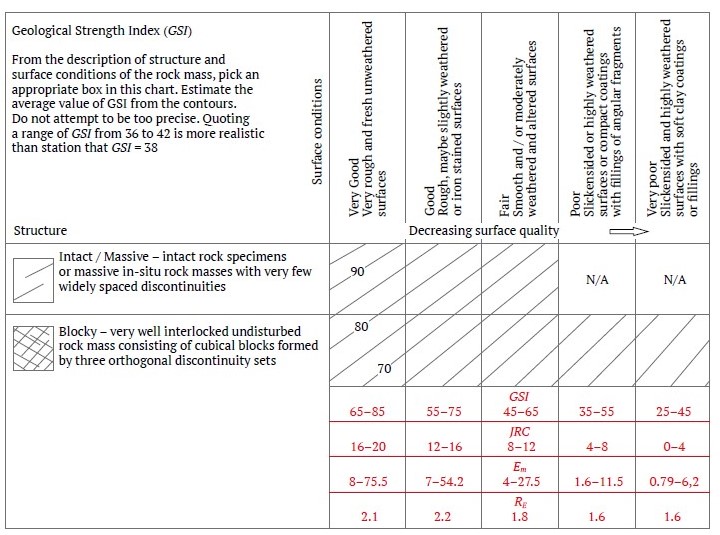
Fig. 17. Deformation modulus, Em, anisotropy index, RE and JRC for blocky rock masses in the GSI chart
Figs. 11 to 14 show that when JRC is assumed to be constant in each column of the GSI table, an increase in one interval in σci results in an average eight-fold increase Em. On the other hand, for a specific value of σci, an increase in JRC by one interval causes an average 24-fold increase in the deformation modulus.
It can be inferred that the effect of the quality of the joints is greater than the strength of the intact rock on the deformation modulus of blocky rock masses.
For example, according to Table 6, at a fixed interval of 50 < σci <100, an increase in the JRC from 0 to 20 results in the deformation modulus increasing from an average of 2.5GPa to 50GPa, which is a 20-fold increase. For 8 < JRC < 12, an increase in σci from σci < 25 MPa to σci < 250 MPa results in the average deformation modulus for the rock mass increasing from 4 GPa to 27.5 GPa. This represents an approximate 6.8-fold increase. Based on this observation, joint roughness affects the deformation modulus about three times more than the intact rock’s UCS.
Table 6
Rock mass deformation modulus as a function of JRC and σci
| GSI | 25–45 | 35–55 | 45–65 | 55–75 | 65–85 | 8-fold increase in deformability modulus on average |
| JRC | 0–4 | 4–8 | 8–12 | 12–16 | 16–20 | |
| σci | Deformation of modulus (GPa) | |||||
| σci < 25 | 0.79–1.75 | 1.6–4 | 4–10 | 7–19 | 8–23 | |
| 25< σci <50 | 1.75–2.8 | 2.75–6 | 7–14.5 | 8–29 | 17–40 | |
| 50< σci <100 | 2.5–5 | 5.2–10 | 8–19.5 | 15–38 | 20–50 | |
| 100< σci <250 | 3.7–6.2 | 6.7–11.5 | 12–27.5 | 18–54.2 | 22–75.5 | |
| 24-fold increase in deformability modulus on average | ||||||
Conclusion
A systematic investigation of anisotropy in the deformation behavior of blocky rock masses is carried out using discrete element simulations. The rock mass consists of two orthogonal joint sets intersected by a third. The third joint set forms a variable angle with the second joint set, and its strike is perpendicular to that of joint set 1. Elements with representative volumes of the masses were uniaxially loaded in different
directions.
New nonlinear stress-dependent relations for the normal and shear stiffness of joints have been introduced and used in the simulations. JRC and intact rock UCS serve as independent variables in these relations. It was determined that joint normal and shear stiffness coefficients significantly influence the overall deformation behavior of the rock mass. Notably, the effect of normal stiffness on the rock mass deformation modulus is approximately twice that of shear stiffness. Additionally, it was observed that the roughness of the joints has a much greater impact on the deformation modulus than the UCS of the intact rock.
An important consideration is the potential presence of thin layers on the joints. In this research, the effects of joint fillers are reflected in the JRC as illustrated in the first row of Table 6. However, the adhesion and friction coefficient on the joint surfaces, which can significantly influence simulation results due to the presence of thin layers, are not detailed. In this context, Voznesenskii et al. [37], conducted comprehensive research discussing the significant impact of thin layers of carbonaceous clays on the contact cracking resistance between different rocks.
Numerical investigations indicated that a mass with L/S ≥ 10 can be considered as a REV for a blocky rock mass when evaluating the deformation modulus and failure modes.
The deformation modulus, failure mode, and post-failure behavior of the blocky rock masses were evaluated for various relative loading and joint angles. The degree of anisotropy for the deformation modulus (due to the fracture systems), represented by the anisotropy index RE, was deduced as 1.6 ≤ RE ≤ 2.3, with an average value of 1.88 in blocky rock masses. When the mode of failure is characterized by “slipping on the joints”, the yield strain ranges from 0.2 to 0.4, independent of the loading angle and the direction of the third joint set.
When the mode of failure is characterized by “slipping on the joints”, the yield strain ranges from 0.2 to 0.4, independent of the loading angle and the direction of the third joint set.
Results are presented in the form of polar curves showing variations in the blocky rock mass deformation modulus, which depend on the joints’ JRC, the intact rock’s UCS, and the rock mass structure in terms of the relative joint angle. These curves facilitate the estimation of the blocky rock mass deformation modulus in different directions without the need for laboratory and in-situ tests or empirical relationships.
In the GSI table, results are categorized such that assigning a JRC value to each class of joint surface conditions allows for the determination of corresponding deformation modulus and degree of anisotropy for GSI values.
References
1. Singh B. Continuum characterization of jointed rock masses: Part I – The constitutive equations. International Journal of Rock Mechanics and Mining Sciences & Geomechanics Abstracts. 1973;10(4):311–335. https://doi.org/10.1016/0148-9062(73)90041-7
2. Gerrard C. M. The equivalent elastic properties of simplified and jointed rock masses. In: Beer G., Brooker J. R., Carter J. P. (Eds.) Proceedings of the 17th International Conference on Computer Methods and Advances in Geomechanics. May 6–10, 1991. Cairns, Australia. Rotterdam: A. A. Balkemam, Brookfield; 1991. Pp. 333–337.
3. Oda M. An experimental study of the elasticity of mylonite rock with random cracks. International Journal of Rock Mechanics and Mining Sciences & Geomechanics Abstracts. 1988;25:59–69.
4. Amadei B., Savage W. Z. Effect of joints on rock mass strength and deformability. In: Hudson J. A. (Ed.) Comprehensive Rock Engineering – Principle, Practice and Projects. Vol. 1. Oxford, UK: Pergamon; 1993. Pp. 331–365.
5. Kulhawy F. H. Geomechanical model for rock foundation settlement. Journal of the Geotechnical Engineering Division. 1978:104(2):211–227. https://doi.org/10.1061/AJGEB6.0000582
6. Serafim J. L., Pereira J. P. Consideration of the geomechanical classification of Bieniawski. In: Proceedings of the International Symposium on Engineering Geology and Underground Construction. Vol. 1. September 12–15, 1983. Lisbon, Portugal; 1983. Pp. 33–44.
7. Gokceoglu C., Sonmez H., Kayabasi A. Predicting the deformation moduli of rock masses. International Journal of Rock Mechanics and Mining Sciences. 2003;40(5):701–710. https://doi.org/10.1016/S1365-1609(03)00062-5
8. Hoek E., Diederichs M. S. Empirical estimation of rock mass modulus. International Journal of Rock Mechanics and Mining Sciences. 2006;43(2):203–215. https://doi.org/10.1016/j.ijrmms.2005.06.005
9. Heuze F. E. Scale effects in the determination of rock mass strength and deformability. Rock Mechanics. 1980;12:167–192. https://doi.org/10.1007/BF01251024
10. Agharazi A., Derek Martin C., Tannant D. A three-dimensional equivalent continuum constitutive model for jointed rock masses containing up to three random joint sets. Geomechanics and Geoengineering. 2012;7(4):227–238. https://doi.org/10.1080/17486025.2012.714476
11. Cundall P. A. A computer model for simulating progressive large scale movements in blocking rock systems. In: Proceedings of the Symposium of the International Society on Rock Mechanics. France. 1971.
12. Lemos J. V., Hart R. D., Cundall P. A. A generalized distinct element program for modeling jointed rock mass. In: Stephansson O. (Ed.) Proceedings of the International Symposium on Fundamentals of Rock Joints. 15–20 September 1985. Bjorkiden, Sweden; 1985. Pp. 335–343.
13. Cundall P. A. Formulation of a three-dimensional distinct element model – Part I. A scheme to detect and represent contacts in a system composed of many polyhedral blocks. International Journal of Rock Mechanics and Mining Sciences & Geomechanics Abstracts. 1988;25(3):107–116. https://doi.org/10.1016/0148-9062(88)92293-0
14. Kulatilake P. H. S. W., Wang S., Stephansson O. Effect of finite size joints on the deformability of jointed rock in three dimensions. International Journal of Rock Mechanics and Mining Sciences & Geomechanics Abstracts. 1993;30(5):479–501. https://doi.org/10.1016/0148-9062(93)92216-D
15. Min K. B., Jing L. Numerical determination of the equivalent elastic compliance tensor for fractured rock masses using the distinct element method. International Journal of Rock Mechanics and Mining Sciences. 2003;40(6):795–816. https://doi.org/10.1016/S1365-1609(03)00038-8
16. Ivars D. M., Pierce M. E., Darcel C. et al. The synthetic rock mass approach for jointed rock mass modelling. International Journal of Rock Mechanics and Mining Sciences. 2011;48(2):219–244. https://doi.org/10.1016/j.ijrmms.2010.11.014
17. Hoek H., Brown E. T. Practical estimates of rock mass strength. International Journal of Rock Mechanics and Mining Sciences. 1997;34(8):1165–1186. https://doi.org/10.1016/S1365-1609(97)80069-X
18. Goodman R. E., Taylor R. L., Brekke T. L. A model for the mechanics of jointed rock. Journal of the Soil Mechanics and Foundations Division. 1968;94(3):637–659. https://doi.org/10.1061/JSFEAQ.0001133
19. Bandis S. C., Lumsden A. C., Barton N. R. Fundamentals of rock joint deformation. International Journal of Rock Mechanics and Mining Sciences & Geomechanics Abstracts. 1983;20(6):249–268. https://doi.org/10.1016/0148-9062(83)90595-8
20. Duncan J. M., Chang C. Y. Nonlinear analysis of stress and strain in soil. Journal of the Soil Mechanics and Foundations Division. 1970;96(5):1629–1655. https://doi.org/10.1061/JSFEAQ.000145
21. Priest S. D. Discontinuity analysis for rock engineering. London etc.: Chapman & Hall; 1993.
22. Barton N., Choubey V. The shear strength of rock joints in theory and practice. Rock Mechanics and Rock Engineering. 1977;10:1–54. https://doi.org/10.1007/BF01261801
23. Barton N. R. Review of a new shear strength criterion for rock joints. Engineering Geology. 1973;7(4):287–332. https://doi.org/10.1016/0013-7952(73)90013-6
24. Barton N. R. The shear strength of rock and rock joints. International Journal of Rock Mechanics and Mining Sciences & Geomechanics Abstracts. 1976;13(9):255–279. https://doi.org/10.1016/0148-9062(76)90003-6
25. Barton N. R., Bandis S. C. Review of predictive capabilities of JRC-JCS model in engineering practice, In: Barton N., Stephansson O. (Eds.) Proceedings of the International Symposium on Rock Joints. November 1990, Loen, Norway. Rotterdam: Balkema; 1990. Pp. 603–610.
26. Deere D. U., Miller R. P. Engineering classification and index properties for intact rock. Technical Report No. AFWL-TR-65-116. Air Force Weapons Laboratory (WLDC). Kirtland Air Base, New Mexico; 1966.
27. Robertson A. The interpretation of geological factors for use in slope theory. In: Planning Open Pit Mines, Proceding of the Symposium on the Theoretical Background to the Planning of Open Pit Mines with Special Reference to Slope Stability. August 29–September 4, 1970, Johannesburg, South Africa. A. A. Balkema; 1970. Pp. 55–71.
28. Goodman R. E. Introduction to Rock Mechanics. 2nd Edition. New York: John Wiley & Sons Ltd.; 1989.
29. Cuba A. Personal Communication. 1990.
30. Schultz R. A. Relative scale and the strength and deformability of rock messes. Journal of Structural Geology. 1996;18(9):1139–1149.
31. Jaeger J. C., Cook N. G. W., Zimmerman R. W. Fundamentals of rock mechanics. Oxford: Blackwell Publishing Ltd.; 2007.
32. Yang Z. Y., Chen J. M., Huang T. H. Effect of joint sets on the strength and deformation of rock mass models. Effect of joint sets on the strength and deformation of rock mass models. International Journal of Rock Mechanics and Mining Sciences. 1998;35(1):75–84. https://doi.org/10.1016/s1365-1609(98)80024-5
33. Bieniawski Z. T. Determining rock mass deformability: experience from case histories. International Journal of Rock Mechanics and Mining Sciences & Geomechanics Abstracts. 1978;15(5):237–247. https://doi.org/10.1016/0148-9062(78)90956-7
34. Hoek E. Practical Rock Engineering. Revision version. 2004.
35. Carvalho J. Estimation of rock mass modulus. Personal communication. 2004.
36. Sonmez H., Gokceoglu C., Ulusay R. Indirect determination of the modulus of deformation of rock mass based on the GSI system. International Journal of Rock Mechanics and Mining Sciences. 2004;41(5):849–857. https://doi.org/10.1016/j.ijrmms.2003.01.006
37. Voznesenskii A. S., Osipov Yu. V., Ushakov E. I. et al. Effect of weak inclusions on the fracture toughness of interfaces between various rocks. Engineering Failure Analysis. 2023;146:107140. https://doi.org/10.1016/j.engfailanal.2023.107140
About the Authors
O. AhramiIslamic Republic of Iran
Omid Ahrami – PhD-Candidate
Tehran
H. Javaheri Koupaei
Islamic Republic of Iran
Hossein Javaheri Koupaei – Assistant Professor
Scopus ID 57215596931
Tehran
K. Ahangari
Islamic Republic of Iran
Kaveh Ahangari – Professor
Scopus ID 36130116400
Tehran
Review
For citations:
Ahrami O., Javaheri Koupaei H., Ahangari K. Determination of deformation modulus and characterization of anisotropic behavior of blocky rock masses. Mining Science and Technology (Russia). 2024;9(2):116-133. https://doi.org/10.17073/2500-0632-2023-08-143


