Scroll to:
Model of time-distance curve of electromagnetic waves diffracted on a local feature in the georadar study of permafrost zone rock layers
https://doi.org/10.17073/2500-0632-2023-05-118
Abstract
In GPR (georadar) studies, one of the most popular procedures for determining electromagnetic waves propagation velocity in a rock mass is the selection of theoretical hyperbolic time-distance curves and subsequent comparison with the time-distance curve obtained from a GPR measurement. This procedure is based on the model of homogeneous medium, but nowadays the subject of GPR study is often inhomogeneous media, such as horizontally layered media characteristic of loose permafrost zone sediments. The paper presents the findings of studying the formation of hyperbolic time-distance curves of georadar impulses in a horizontally layered medium without taking into account the dispersion and absorption of electromagnetic waves. On the basis of geometrical optics laws, formulas were derived to calculate the shape of the hyperbolic lineup of georadar impulses reflected from a local feature in a multilayer frozen rock mass. On the example of a permafrost zone rock mass containing a layer of unfrozen rocks, the effect of the thicknesses of rock layers and their relative dielectric permittivity on the apparent dielectric permittivity resulting from the calculation of the theoretical hyperbolic time-distance curve was shown. The conditions under which it is impossible to determine the presence of a layer of unfrozen rocks from a hyperbolic time-distance curve are also presented. The established regularities were tested on synthetic georadar radargrams calculated in the gprMax software program. The findings of the theoretical studies were confirmed by the comparison with the results of the analysis of the georadar measurements computer simulation data in the gprMax system (the relative error was less than 0.5%).
Keywords
For citations:
Sokolov K.О. Model of time-distance curve of electromagnetic waves diffracted on a local feature in the georadar study of permafrost zone rock layers. Mining Science and Technology (Russia). 2024;9(3):199-205. https://doi.org/10.17073/2500-0632-2023-05-118
Model of time-distance curve of electromagnetic waves diffracted on a local feature in the georadar study of permafrost zone rock layers
Introduction
One of the geophysical problems to be solved by using GPR (georadar) method is the study of physical and mechanical properties of rocks. However, accumulation of experimental data and development of methodological support for GPR in this area is much slower [1, 2] than in other areas [3] that leads to underestimation of the capabilities of the georadar method.
The reasons that led to this state of affairs in georadar application can be different. One of them is the incorrect use of the procedure for determining the velocity v of electromagnetic wave (EMW) propagation using hyperbolic time-distance curves (lineups of georadar impulses). This procedure is the most common way to estimate EMW velocity [1], based on which the material part of the relative complex dielectric permittivity ε′, depending on moisture, density, and cryogenic state of rocks, is calculated [4]. In training manuals (both domestic [1, 2] and foreign [5, 6]), as well as in data processing manuals of georadar manufacturers (GSSI, GEOTECH) and American Society for Testing and Materials (ASTM) standard1, justification of application of EMW propagation velocity determination by hyperbolic time-distance curves is given for the case when the host medium is homogeneous.
Currently, in the practice of georadar measurements [3, 7, 8], as well as in scientific works devoted to the automation of the search for hyperbolic time-distance curves in GPR data [9–11], including on a real-time basis [12], the study subject is, as a rule, an inhomogeneous medium. As a consequence, the EMW propagation velocity determined by a hyperbola located in some layer is an averaged (integral) characteristic of all overlying layers, as mentioned in the work of one of the GPR classics [13]. When conducting georadar studies in a permafrost zone, it is possible to incorrectly assess the cryogenic state of rocks and, correspondingly, their physical and mechanical properties in the presence of a layer of thawed rocks, whose effect on the shape of the hyperbolic time-distance curve may be significant but insufficient for the result of v determination by the method of approximation of the time-distance curve by a hyperbola [2] proved to be within the range of values characteristic of thawed rocks. Thus, in a layered medium it is possible to determine the true velocity v of EMW propagation directly from the hyperbolic time-distance curve only in the first layer of rocks, and for the correct use of v values in the practice of georadar works it is necessary to establish the regularities of formation of EMW time-distance curves diffracted at a local feature in a layered rock mass. In order to achieve the above goal, the following tasks need to be accomplished:
- develop a model of a hyperbolic time-distance curve of impulses obtained in the study of a layered rock mass;
- establish the dependence of v and ε′ determined from the hyperbolic time-distance curve on the values of v and ε′ of the overlying layers;
- determine the influence of a thawed layer in a frozen rock mass on the v value calculated from the hyperbolic time-distance curve;
- verify the validity of the obtained theoretical results using the data of computer simulation.
1 ASTM D6432-11, Standard guide for using the surface ground penetrating radar method for subsurface investigation, ASTM International, West Conshohocken, PA; 2011. https://doi.org/10.1520/D6432-11
Model of a hyperbolic time-distance curve of georadar impulses obtained from probing of a layered rock mass
EMW emitted by a georadar located at point x propagates in a layered rock rock mass according to Fermat’s principle (gray solid line in Fig. 1), but in this paper we consider a model of EMW propagation along a raypath (black dashed line in Fig. 1) in a rock mass consisting of n layers of hi thickness with given values of ε′i and vi with i ranging 1 to n. A local feature, indicated by the black circle in Fig. 1, is located in the last layer at depth h0. The distance hr, traveled by the ray from georadar to the local feature, will be equal to:

When moving the georadar along the profile, the x coordinate will increase, while hr will correspondingly decrease, forming the left branch of the hyperbola and reaching a minimum at the point х = х0, where the vertex of the hyperbola will be located. At х > х0, the values of hr will increase and correspond to the right branch of the hyperbola. In the intermediate layer numbered i, the ray travels a distance hri, which is greater than the thickness of the layer hi at all points except х0:

where

Since in the last layer the ray travels a distance smaller than hn, then hrn will be equal to:
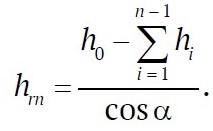
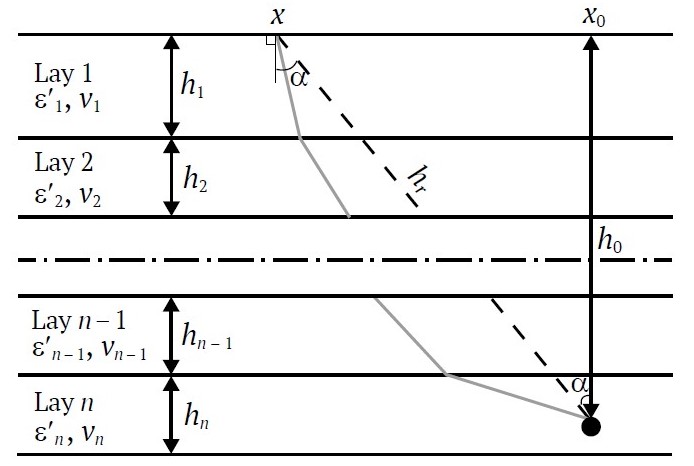
Fig. 1. Schematic diagram of the model of electromagnetic wave propagation in a layered rock mass
The ray propagation time in layer i:

The total time tr of the ray propagation from the georadar to a local feature will be:

Then the averaged ray velocity will be equal to:

Equation of a hyperbolic time-distance curve in a homogeneous medium [2]:

For a horizontally layered medium, equation (1) will take the following form:

Based on the basic trigonometrical identity and the positivity of the cosine function in the area of arcsine values, we transform the denominator of the fraction:
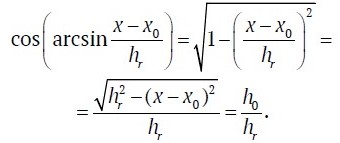
Then the equation of the hyperbolic time-distance curve of GPR impulses reflected from a local feature located in a layered rock mass can be represented as (2). When substituting parameters for a single-layer medium into equation (2), it coincides with expression (1):

When processing georadar data, the hyperbolic time-distance curve having the form corresponding to expression (2) is approximated by a hyperbola having the form according to equation (1). The values of EMW propagation velocity calculated as a result of such approximation are not true, but apparent (vapp), and represent some integral value of EMW velocities in all overlying layers. To determine the dependence of vapp on the values of v in the layers overlying the local feature, we equate equations (1) and (2) to each other:

And let’s express vapp:

According to the known dependence v = c/√ε′ (с = 300 000 km/s = 0.3 m/ns) [2], the apparent dielectric permittivity will be equal to:

It is impossible to estimate the EMW propagation velocity in the rocks of a particular layer from the value of vapp, and it can be assumed that v of each layer is in the range of vapp ± Δv. For example, if in GPR measurements of a permafrost rock mass with v in the narrow range of 100–150 m/μsec (the average value vavr ≈ 125 m/μsec) [14] vapp will be higher than 100 m/μsec, then the rock mass as a whole can be characterized as frozen. However, in such rock masses there may be a layer of rocks in thawed state, which can be detected by georadar data, but there is a problem with its identification [15]. In this connection there is a problem of determining the influence of a layer of rocks with a low value of vavr on vapp.
To solve this problem, we used formula (3) and the fact that v of frozen rocks varies within narrow limits, and the velocity of EMW propagation in unfrozen (thawed) rocks vth is much lower [2]. Let’s represent a part of a frozen rock mass as layers of the same thickness havr, in each of which the EMW propagation velocity will be equal to the average value vavr. The frozen part of the rock mass can be divided into layers arbitrarily, since at the same v their number and thickness do not affect the traveltime of GPR impulses that make up the hyperbolic lineup. The thickness hth and velocity vth in and thawed rock layer are represented as proportional to havr and vavr:
hth = khvavr, vth= kvvavr.
After substitution into (3), we obtain an expression for the apparent velocity vapp.th of EMW propagation in a frozen rock mass containing a layer of thawed rocks:
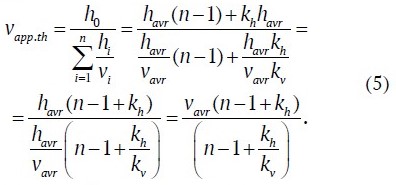
At kh = 0, according to formula (5), vapp.th = vavr, i.e. it will correspond to frozen rock mass. In order to determine how vapp will change compared to vavr in the presence of a low-velocity layer of thawed rocks, let us divide formula (3) with the frozen rock parameters havr and vavr for all layers, denoted by vapp.fr, by expression (5):

Verification of the obtained theoretical expressions using computer simulation data
A simulation of GPR data was performed in the gprMax system [16], which has positively proved itself in studies devoted to the determination and analysis of hyperbolic lineups of GPR impulses [17–19]. The following parameters were used in the simulation: probing impulse – Ricker pulse with Fourier spectrum center frequency of 400 MHz, time-base sweep of 150, baseline of 0 mm. The data for the simulation are presented in the table below.
Input file text for gprMax for model #1:
#domain: 4 9.1 0.002
#dx_dy_dz: 0.002 0.002 0.002
#time_window: 150e-9
#material: 6 0 1 0 sloi1
#material: 4 0 1 0 sloi2
#waveform: ricker 10 0.4e9 my_ricker
#hertzian_dipole: z 0.1 9 0 my_ricker
#rx: 0.1 9 0
#src_steps: 0.01 0 0
#rx_steps: 0.01 0 0
#box: 0 0 0 4 9 0.002 sloi1
#box: 0 0 0 4 7 0.002 sloi2
#cylinder: 2 5 0 2 5 0.002 0.01 pec
Table
Parameters of rock mass models
| Model No. | Quantity of layers | Layer thickness, m | ε′ | v, m/μs | h0, m |
| 1 | 2 | 2; 7 | 6; 4 | 122.5; 150 | 4 |
| 2 | 3 | 2; 2; 4 | 8; 6; 4 | 100; 122.5; 150 | 6 |
| 3 | 4 | 1; 1; 1; 0.5; 2 | 6; 4; 6; 20; 4 | 122.5; 150; 122.5; 67; 150 | 4.5 |
The simulation result (out-file) was exported to the format of the GeoScan32 software program (of SPC GEOTECH manufacturer), in which the depth scale origin and the Baseline parameter equal to 1 were set. Fig. 2, a shows the results of the simulation (Model #1), the values of ε′app, calculated using the “Hyperbola” procedure, and vapp. The traveltimes of impulses reflected from the lower boundary of layer 1 t1 and from the local feature, the top of the hyperbola, th, according to formula (1) are equal to:
t1 = 32.7 ns; th = t1 + 26.7 = 59.4 ns.
According to formulas (3) and (4), vapp and ε′app are equal to:
vapp = 0.1349 m/ns = 134.9 m/µs; ε′app = 4.9484.
Verification of the values obtained:

Thus, the relative error of the values of vapp and ε′app calculated in the GeoScan32 program was 0.07 and 0.37%, respectively. For model No. 2, from the calculations by formulas (3) and (4), the values of vapp = 123.7 m/μsec, ε′app = 5.8853 were obtained.
To verify formula (6), we first calculate vapp.fr for the model of frozen rock mass with thickness h0 = 5 m, consisting of n = 5 layers with h = 1 m, v = 122.5, 150, 122.5, 134.2, 150 m/μs and ε′ = 6; 4; 6; 5; 4. According to expression (3), vapp.fr = 134.7 m/µs.
Further, instead of the fourth layer, we introduce a low-velocity layer (model No. 3 in the Table) with such parameters hth, vth so that the value of vapp.th is in the range characteristic of thawed rocks. Let us set the thickness of the thawed layer hth = 0.5 m (thus h0 decreases to 4.5 m) as half (kh = 0.5) of the thickness of the averaged layer havr = 1 m, and the EMW propagation velocity in it is two times less (kv = 0.5) than the average value (at ε′avr = 5) of vavr = 134.2 m/µs, i.e. vth = 67.1 m/µs, ε′th = (avr/vth)2 = 20. Other parameters of the simulated rock mass are presented in the Table. According to formula (3), vapp.th = 121.2 m/μsec, which is confirmed by the result of the calculation of vapp based on the computer simulation data (Fig. 2, c), the relative error of which, compared to the exact value, was less than 0.5%.
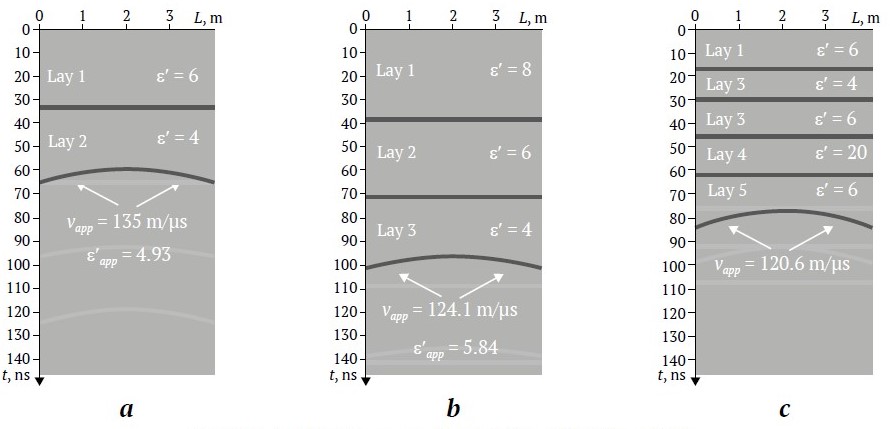
Fig. 2. Synthetic radargrams of models Nos. 1(a), 2(b) and 3(c)
Now we can calculate how the apparent EMW propagation velocity in the rock mass model has changed with the introduction of a low-velocity layer (into the model):

That is, in the presence of a low-velocity layer with the above parameters, vapp decreases by ≈10%. In order to obtain this result, we had to carry out the whole set of calculations to calculate vapp both for a fully frozen rock mass and for the case with a layer of unfrozen (thawed) rocks. Such calculations can be substantially simplified if we use formula (6), which allows to obtain the same result with accuracy to thousandths:

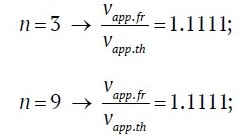
To confirm that formula (6) is correct when the frozen part of a rock mass is subdivided into an arbitrary number of layers, calculations were performed for the model with 3 and 9 layers. Only one parameter, kh, changes, for instance, at n = 3 (h = 2, 0.5, 2 m), kh = 0.25, at n = 9 (thickness of each layer is 0.5 m), kh = 1:
In general, to determine whether vapp.th will be within the range of the values characteristic of frozen rocks, for example, in Central Yakutia, at arbitrary kh, kv, we substitute into formula (5) the averaged values characteristic of this region, vavr = 125 m/µs and vapp.th = 100 m/µs [14], then with a very significant difference between vapp.fr and vapp.th:

we obtain from (5):

from where

When vapp.th increases or vapp.fr decreases, expression (7) will be greater than 0.8, and the ratio vapp.fr/vapp.th will decrease, which will lead to difficulties in interpreting GPR data to identify the presence of a layer of thawed rocks on the basis of analyzing the hyperbolic time-distance curve of GPR impulses. The estimation of the feasibility of detecting the layer of thawed rocks based on the values of parameters kh, kv according to formula (7) was performed for the region of Central Yakutia. For other regions the calculation should be accomplished with the corresponding values of EMW propagation velocities in frozen and thawed rocks.
Conclusions
The performed study allowed to develop a model of hyperbolic time-distance curve of GPR impulses reflected from a local feature located in a rock mass with an arbitrary number of layers. On the basis of the developed model, the expressions for the apparent values of electromagnetic wave propagation velocity and the material part of the relative complex dielectric permittivity calculated from the hyperbolic time-distance curve of georadar impulses were obtained. The obtained expressions allowed us to determine how the velocity of electromagnetic wave propagation in a rock mass containing a layer of unfrozen (thawed) rocks decreases compared to a fully frozen rock mass. The findings of the theoretical studies were confirmed by comparison with the results of the analysis of the data of the georadar measurements computer simulation in the gprMax system (the relative error was less than 0.5%).
The results obtained in the course of the study are of great importance for the development of methodological support of GPR for determining electrophysical properties of rocks, which will increase the reliability of the assessment of their physical and mechanical properties, especially in the area of permafrost occurrence. Practical application of the obtained results in studies aimed at automated determination of electrophysical properties of rocks and soils by hyperbolic time-distance curves will allow to create a database with up-to-date information on dielectric permittivity of rocks.
References
1. Starovoitov A. V. Interpretation of georadar data. Мoscow: MSU Publ. House; 2008. 192 p. (In Russ.)
2. Vladov M. L., Sudakova M. S. Georadar. From physical fundamentals to upcoming trends. Мoscow: GEOS Publ. House; 2017. 240 p. (In Russ.)
3. Lombardi F., Podd F., Solla M. From its core to the niche: insights from GPR applications. Remote Sens. 2022;14(13):3033. https://doi.org/10.3390/rs14133033
4. Frolov A. D. Electrical and elastic properties of frozen rocks and ice. Pushchino: ONTI PNTs RAS Publ.; 1998. 515 p. (In Russ.)
5. Persico R. Introduction to ground penetrating radar: inverse scattering and data processing. New Jersey: Wiley-IEEE Press; 2014. 392 с. https://doi.org/10.1002/9781118835647.ch2
6. Jol H. M. Ground penetrating radar: theory and application. Elsevier; 2008. 544 p. https://doi.org/10.1016/B978-0-444-53348-7.X0001-4
7. Dyakov A. Yu., Kalashnik A. I. Methodological fundamentals of GPR studies of mining features. Apatity: FITs KSC RAS Publ.; 2021. 110 p. (In Russ.) https://doi.org/10.37614/978.5.91137.443.3
8. Solla M., Perez-Gracia V., Fontul S. A review of GPR application on transport infrastructures: troubleshooting and best practices. Remote Sens. 2021;13(4):672. https://doi.org/10.3390/rs13040672
9. Wunderlich T., Wilken D., Majchczack B. S. et al. Hyperbola detection with retinanet and comparison of hyperbola fitting methods in GPR data from an archaeological site. Remote Sensing. 2022;14:3665. https://doi.org/10.3390/rs14153665
10. Mertens L., Persico R., Matera L., Lambot S. Automated detection of reflection hyperbolas in complex gpr images with no a priori knowledge on the medium. In: IEEE Transactions on Geoscience and Remote Sensing. 2016;1:580–596. https://doi.org/10.1109/TGRS.2015.2462727
11. Lei W., Hou F., Xi J. et al. Automatic hyperbola detection and fitting in GPR B-scan image. Automation in Construction. 2019;106:102839. https://doi.org/10.1016/j.autcon.2019.102839
12. Dou Q., Wei L., Magee R., Cohn A. G. Real-time hyperbola recognition and fitting in GPR data. In: IEEE Transactions on Geoscience and Remote Sensing. 2017;55(1):51–62. https://doi.org/10.1109/TGRS.2016.2592679
13. Daniels J. J. Fundamentals of ground penetrating radar. In: Symposium on the Application of Geophysics to Engineering and Environmental Problems. 1989;1:62–142. https://doi.org/10.4133/1.2921864
14. Omelyanenko A. V., Fedorova L. L. Georadar studies of permafrost. Yakutsk: YaSC SB RAS Publ.; 2006. 136 p. (In Russ.)
15. Yakupov V. S. Geophysics of permafrost zone. Yakutsk: Yakutsk State University Publ.; 2008. 342 p. (In Russ.)
16. Warren C., Giannopoulos A., Giannakis I. gprMax: Open source software to simulate electromagnetic wave propagation for Ground Penetrating Radar. Computer Physics Communications. 2016;209:163–170. https://doi.org/10.1016/j.cpc.2016.08.020
17. Wunderlich T., Wilken D., Majchczack B. S., et al. Hyperbola detection with RetinaNet and comparison of hyperbola fitting methods in GPR data from an archaeological site. Remote Sensing. 2022;14:3665. https://doi.org/10.3390/rs14153665
18. Dewantara D., Parnadi W. W. Automatic hyperbola detection and apex extraction using convolutional neural network on GPR data. Journal of Physics: Conference Series. 2022;1:012027. https://doi.org/10.1088/1742-6596/2243/1/012027
19. Wang H., Ouyang S., Liao K.-F., Jin L.-N. GPR B-SCAN image hyperbola detection method based on deep learning. Acta Electronica Sinica. 2021;49(5):953-963. https://doi.org/10.12263/DZXB.20200635
About the Author
K. О. SokolovRussian Federation
Kirill O. Sokolov – Cand. Sci. (Eng.), Senior Researcher
Scopus ID 56457950500, ResearcherID P-8843-2016
Yakutsk
Review
For citations:
Sokolov K.О. Model of time-distance curve of electromagnetic waves diffracted on a local feature in the georadar study of permafrost zone rock layers. Mining Science and Technology (Russia). 2024;9(3):199-205. https://doi.org/10.17073/2500-0632-2023-05-118
JATS XML


