


Contents
Scroll to:
https://doi.org/10.17073/2500-0632-2025-08-1020
Scroll to:
This study addresses the growing recognition of zirconium raw materials as a critical mineral resource in most industrialized countries and the need for a comprehensive assessment of the complex global zirconium market. Using statistical, graphical, and analytical methods, the study examines the zirconium resource base, the spatial distribution of zirconium deposits by geological type, global commodity flows (production, imports, exports, and consumption) by country, as well as prices and future production and consumption trends. The analysis shows that global consumption of zirconium raw materials has increased rapidly, from 39 kt in 1950 to 2.191 Mt in 2024. The main demand-side trend is the sharp rise in consumption in China, driven by rapid economic growth: from 84 kt (8.7% of the global market) in 1997 to 1.83 Mt (78%) in 2024. At the same time, growth of the global zirconium raw materials market is constrained by rising demand and prices, the high share of international trade, and conflicting interests between producing countries (Australia, South Africa, Mozambique, Indonesia, and Senegal) and the major consuming countries (China, the European Union, the United States, India, and Japan). Another major challenge is that a significant share of global reserves is located in complex endogenic deposits that are difficult to develop both technologically and economically. In most industrialized countries, zirconium is classified as a critical mineral resource. Global proven reserves of zirconium raw materials in developed deposits are estimated at 95 Mt, while forecast resources amount to 232 Mt. Production is currently concentrated mainly in titanium-zirconium placer deposits; however, zirconium also occurs in complex endogenic deposits in carbonatites and alkaline igneous rocks in the form of zircon, baddeleyite, and eudialyte. Global production of zircon concentrate increased from 537 kt in 1970 to 1.64 Mt in 2024 (+2.4% per year), while cumulative global production for 1950–2024 reached 59.7 Mt. Export supply of zircon concentrate to the global market, including re-exports, increased from 395 kt in 1970 to 1.86 Mt in 2024. In the 2010s, the share of exports in global zirconium raw material production ranged from 61% to 98%. High demand led to the emergence of a new group of producers developing placer deposits in Indonesia, Mozambique, Senegal, Kazakhstan, Madagascar, Kenya, Vietnam, and Sierra Leone. Their share of global exports increased from 0.2% in 1999 to 30% in 2024. Production from placer deposits may increase significantly in Mozambique, Madagascar, and Vietnam, while new mining operations may also emerge in Namibia and Tanzania. In addition to placer deposits, projects are being considered for the development of complex endogenic deposits in which zircon concentrate would be produced as a by-product, including Strange Lake and Thor Lake (Canada), Bear Lodge (USA), Baerzhe, Bozigor, and Tudiling (China), Khalzan-Buregtei (Mongolia), and Katuginskoye, Ulug-Tanzekskoye, and Zashikhinskoye (Russia). Development of deposits representing a new technological type—eudialyte ores, which constitute complex zirconium–rare-earth raw materials, is also possible. These projects include Nechalacho (Canada), Tanbreez–Kvanefjeld (Greenland), Toongi–Dubbo (Australia), Lovozerskoye (Russia), and Saima (China).
Boyarko G.Yu., Bolsunovskaya L.M. Global zirconium market as a critical mineral raw material. Mining Science and Technology (Russia). 2026;11(1):16-34. https://doi.org/10.17073/2500-0632-2025-08-1020
Since the 1920s, zirconium raw materials have been used primarily as refractories, anti-adhesion coatings and high-temperature ceramics, both in the form of zirconium silicate (natural zircon) and zirconium oxide – natural (baddeleyite) and synthetic, produced during the processing of zircon [1]. Beginning in the 1950s, a portion of zirconium raw materials has been processed to produce metallic zirconium used in the nuclear industry [2]. New zirconium dioxide-based materials have since been developed, including single crystals, thin-film coatings, microfibers, nanopowders, and composite materials. Accordingly, the range of applications for zirconium products has expanded. The biocompatibility of zirconium products enables their use in medical devices, including dental implants, joint replacements and bone screws [3].
Global consumption of zirconium raw materials increased from 35–60 kt per year in the early 1950s to 1.83–2.34 Mt/year in the 2020s. In most developed industrial countries, zirconium is regarded as a critical mineral raw material [4–6]. The rapid growth in the consumption of zirconium raw materials necessitates assessing the adequacy of the global mineral resource base and analyzing changes in global commodity flows.
To examine the mineral resource base of zirconium, data on global zirconium production for the period 1950–2022 were compiled1. Production is understood here as the mining of zirconium deposits followed by the production of concentrate. The volumes of mining, imports, exports, and consumption of zirconium raw materials (zircon and baddeleyite concentrates) are reported in metric tons. Prices for zirconium raw materials are given in USD per metric ton. Reserves and resources of zirconium raw materials are expressed in terms of 100 % ZrO2.
For indicators of commodity flow volumes, the baseline data were taken from the U.S. Geological Survey (USGS). These data were compared with information from the British Geological Survey, the United Nations Data, the TrendEconomy platform, the Mineral Information and Analytical Center and national customs statistics of individual countries, primarily China. When discrepancies between sources were identified, values reported by at least two independent sources were adopted.
For a long period (1959–2014), USGS statistical reports did not contain direct data on zirconium raw material production; therefore, these values were determined indirectly based on the balance of available information on imports, exports, national consumption, and stock changes of these products. Data on zirconium raw material commodity flows in Australia for the period 2007–2024 are also nontransparent: the reported export figures (and, accordingly, production levels) are significantly lower than the import volumes of Australian zircon concentrate reported by importing countries (primarily China). For this period, Australian import and production figures were adjusted based on the difference between Australia’s reported export volumes and China’s reported imports from Australia.
Information on China’s imports of zirconium raw materials prior to 1991 is almost entirely unavailable; therefore, the country’s domestic consumption in the 1970s–1980s was most likely underestimated. Estimates of zirconium raw material production in China for the period 2006–2024 also vary considerably across different sources. Data on reserves and forecast resources for individual countries were compiled using the most recent information from the Information and Analytical Center “Mineral”, the U.S. Geological Survey (USGS), and national statistical agencies. These figures were further adjusted to account for extraction volumes (reserve depletion) and reported additions to reserves resulting from national geological exploration programs, reflecting the situation as of 2022.
1 Data sources: U.S. Geological Survey. URL: http://minerals.usgs.gov/minerals/pubs/commodity/tin/index.html#mcs; British Geological Survey. URL: https://www.bgs.ac.uk/; United Nations Data. URL: https://data.un.org/; TrendEconomy. Open Data Portal. URL: https://trendeconomy. ru/; Mineral Information and Analytical Center. URL: https://www.mineral.ru/
Between 1950 and 2022, a total of 59.7 Mt of zirconium raw materials (zircon and baddeleyite concentrates) were produced worldwide (Fig. 1). From production levels of 33–75 kt per year in 1950–1955, concentrate supply increased to 1.52–1.63 Mt/year in 2020–2024 (Fig. 2), corresponding to an average annual supply growth rate of +5.7%.

Fig. 1. Cumulative zirconium raw material production by country worldwide, 1950–2024, Mt
Sources: U.S. Geological Survey. URL: http://minerals.usgs.gov/minerals/pubs/commodity/tin/index.html#mcs;
British Geological Survey. Commodities & Statistics. URL: https://www.bgs.ac.uk/; United Nations Data. URL: https://data.un.org/
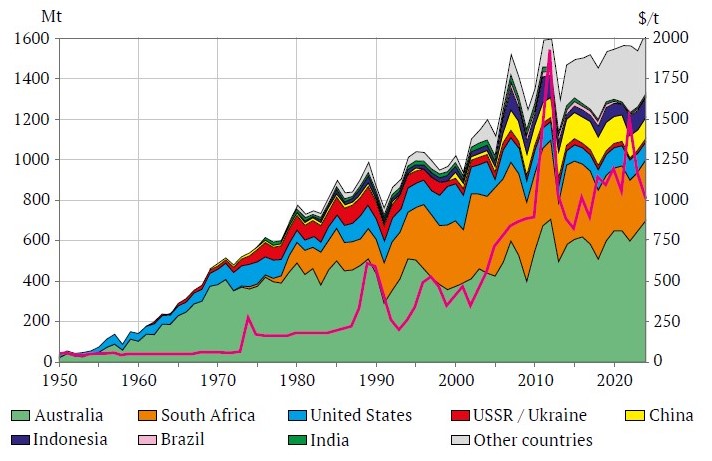
Fig. 2. Dynamics of global zircon concentrate production by countries with the largest cumulative output and its average global price, 1950–2024
Sources: U.S. Geological Survey. URL: http://minerals.usgs.gov/minerals/pubs/commodity/tin/index.html#mcs;
British Geological Survey. Commodities & Statistics. URL: https://www.bgs.ac.uk/;
United Nations Data. URL: https://data.un.org
Zircon concentrate, which accounts for about 99% of all zirconium raw materials produced, is obtained exclusively from the development of coastal marine placer deposits (both modern and buried). Baddeleyite concentrate, produced in very small quantities, is derived from ores of carbonatite deposits.
In the 1930s, global consumption of zirconium raw materials was below 5 kt per year. Zircon concentrate production at that time took place in Brazil (the leading producer until 1935), India, Senegal, Madagascar, and Japan. In 1928, the development of titanium-zirconium placers began in the United States (on a relatively small scale), followed by the start of production in Australia in 1932, which rapidly became the dominant global producer of zirconium raw materials.
The 1950s marked the beginning of a period of rapid growth in global zirconium raw material consumption, largely driven by a sharp increase in prices for metallic zirconium used in the nuclear industries of the United States, the USSR, and France. Demand for zirconium oxide used in refractory materials and high-temperature ceramics also increased. As a result, zircon concentrate production rose from 50 kt in 1952 to 465 kt in 1971, while global consumption expanded at a very high rate of +13.2% per year during this period. Australia accounted for 60–80% of global zirconium raw material production, while the United States contributed 15–25%. Beginning in 1962, zirconium raw material production also started in the USSR, reaching 3–4% of global output.
During the 1970–1990s, global zirconium raw material production increased from 510 kt in 1972 to 1.01 Mt in 1997. At the same time, the growth rate of global consumption slowed to +2.6% per year, slightly below the average global economic growth rate for that period (+3.24% per year). Production levels of the global leader, Australia, remained relatively stable at 350–520 kt per year, although its share of global output declined from 70% in 1972 to 50% in 1997. This reduction was largely due to the emergence of South Africa as a major new supplier, increasing its production from 15 kt in 1977 to 320 kt in 1996 (32% of global output). The USSR also expanded production during this period to 80–90 kt per year (8–11% of global output), while the United States, despite increasing production to 80–120 kt per year, saw its share of global supply decline to 8–13%, compared with 17–30% in the 1960s.
In the 21st century, global consumption of zirconium raw materials accelerated again (+3.5% per year, compared with global economic growth of +3.28% per year) and reached 2.34 Mt in 2024. The supply of zircon concentrate increased from Australia (up to 700 kt per year) and South Africa (up to 420 kt per year). Several new producers also emerged: China, which increased production from 15 kt in 1999 to 140 kt per year; Indonesia (up to 130 kt per year); Mozambique (up to 100 kt per year); Kenya (up to 90 kt per year); Kazakhstan (up to 78 kt per year); Senegal (up to 65 kt per year); and Vietnam (up to 40 kt per year). At the same time, production declined in Ukraine, which inherited zirconium production capacity from the USSR, decreasing from 60–80 kt per year in the 1990s to about 10 kt per year in the 2020s.
Australia accounts for 48.8% of cumulative global zirconium raw material production (29.1 Mt). Zircon mining in the country began in 1932 with the development of beach sand deposits at Greenbushes and Cheynes Beach in the Perth Basin of Western Australia. Following substantial production growth in the 1950–1970s, Australia became the dominant global supplier of zircon concentrate (accounting for 83% of global demand in 1970) and continues to hold up to 50% of the global zirconium raw material market, exporting up to 916 kt of zircon concentrate per year. Australia hosts some of the largest coastal placer basins in the world, containing numerous deposits: the Perth Basin (Coburn, Eneabba, South Tutunup, Keysbrook, Cataby, Cooljarloo, Thunderbird); the Eucla Basin (Jacinth, Ambrosia, Tripitaka); the Murray Basin (Douglas, Donald, Mindarie, Pooncarie, Euston); and deposits on the Tiwi Islands (Kilimiraka, Lethbridge South) [7–9] (Fig. 3). In addition to placer deposits, Australia also hosts primary zirconium ore deposits, including the large zirconium–rare earth (eudialyte) deposit Toongi, located in alkaline syenites [10]. This deposit is currently being prepared for development as part of the Dubbo Zirconium Project.

Fig. 3. World map showing the distribution of zirconium deposits and the leading producers, exporters, and importers of zirconium raw materials. Compiled using data from [7, 8].
Zirconium deposits: 1–4 – Canada (1 – Thor Lake, 2 – Nechalacho, 3 – Athabasca, 4 – Strange Lake, 5 – Kipawa Lake); 6 – Greenland
(Tanbreez–Kvanefjeld); 7–19 – United States (7 – Coos Bay, 8 – Bear Lodge, 9 – Aurelian Springs, 10 – Hickory, 11 – Lulaton,
12 – Mission, 13 – Amelia, 14 – Folkston, 15 – Boulogne, 16 – Green Cove Springs, 17 – Brink, 18 – Concord, 19 – Trail Ridge);
20–23 – Brazil (20 – Guai, 21 – Cumuruxatiba, 22 – Guaratiba, 23 – Poços de Caldas); 24–25 – Senegal (24 – Diogo,
25 – Kayar–Lompoul); 26 – Gambia (Brufut); 27–29 – Sierra Leone (27 – Sembekhan, 28 – Bradford–Rotifunk, 29 – Gbangbama–Mogbwemo);
30 – Cameroon (Tongo–Gandima); 31–33 – Namibia (31 – Cape Cross, 32 – Omaruru, 33 – Swakopmund); 34–40 – South Africa
(34 – Namaqua, 35 – Tormin, 36 – Fairbreeze, 37 – Hillendale, 38 – Richards Bay, 39 – Palabora, 40 – Pilanesberg);
41–45 – Mozambique (41 – Corridor Sands, 42 – Pilivili, 43 – Namalope, 44 – Sangage, 45 – pegmatites Muiane, Naimpa, Nanro,
Macula, Morrua, Marropino); 46 – Madagascar (Toliara); 47 – Tanzania (Fungoni); 48 – Kenya (Kwale, Vipingo, Kilifi, and Mambrui);
49 – Somalia (Kismayo); 50 – Egypt (Rashid); 51 – Turkey (Büyük Kuluncak); 52 – Germany (Cuxhaven); 53 – Sweden (Norra Kärr);
54–58 – Ukraine (54 – Stremigorodskoye, 55 – Irshanskoye, 56 – Malyshevskoye, 57 – Mezhdurechenskoye, 58 – Volchanskoye);
59–74 – Russia (59 – Kovdor, 60 – Lovozero, 61 – Sakharyok, 62 – Unecha, 63 – Lukoyanovskoye, 64 – Tsentralnoye,
65 – Beshpagirskoye, 66 – Yaregskoye, 67 – Tarskoye, 68 – Tuganskoye, 69 – Ulug-Tanzekskoye, 70 – Zashikhinskoye,
71 – Katuginskoye, 72 – Algama, 73 – Rucharskoye, 74 – Khalaktyrskoye); 75–77 – Kazakhstan (75 – Shakashskoye,
76 – Obukhovskoye, 77 – Karaotkel); 78 – Mongolia (Khalzan-Buregtei); 79 – North Korea (Samchon); 80 – South Korea (Dancheon);
81–84 – India (81 – Kerala, 82 – Chavara, 83 – Chhatrapur, 84 – Srikurmam); 85–87 – Sri Lanka (85 – Trincomalee, 86 – Pulmoddai,
87 – Beruwala); 88 – Bangladesh (Cox’s Bazar Beach); 89–97 – China (89 – Bozigor, 90 – Baerzhe, 91 – Saima, 92 – Bohaiwan,
93 – Tudiling, 94 – Lingshui, 95 – Wanning, 96 – Qionghai, 97 – Wenchang); 98–102 – Vietnam (98 – Cam Hoa, 99 – Ky Ninh,
100 – Ke Sung, 101 – De Ji [Cat Khanh], 102 – Ham Tan); 103–105 – Indonesia (103 – Bangka–Belitung, 104 – Mandiri,
105 – Tisma); 106–123 – Australia, including: 106 – Toongi; Perth Basin: 107–113 (107 – Coburn, 108 – Eneabba,
109 – South Tutunup, 110 – Keysbrook, 111 – Cataby, 112 – Cooljarloo, 113 – Thunderbird); Eucla Basin: 114–116 (114 –Jacinth,
115 – Ambrosia, 116 – Tripitaka), Murray Basin: 117–121 (117 – Douglas, 118 – Donald, 119 – Mindarie, 120 – Pooncarie,
121 – Euston); Tiwi Islands: 122–123 (122 – Kilimiraka, 123 – Lethbridge South); 124 – New Zealand (Barrytown)
South Africa, a traditional supplier of mineral raw materials, ranks second among producers and exporters of zirconium raw materials since the 1970s in terms of cumulative production of zirconium products (12.9 Mt, or 21.7% of total global cumulative production) [8, 11]. After the commissioning of the Richards Bay deposit in 1977, the country reached a production level of about 150 kt/year in the 1980s (14–22% of global production). In the 1990s, production increased to 230–320 kt/year (17–36%), in the 2000s to 320–420 kt/year (20–33%), in the 2010s to 320–380 kt/year (20–28%), and in the 2020s to 290–310 kt/year (18–21%) (see Figs. 2, 4 a, b). Coastal-marine placer deposits currently under development include Namakwa, Tormin, Fairbreeze, Hillendale, and Richards Bay [6, 7, 11] (see Fig. 3). At the Palabora copper-phosphate carbonatite deposit, by-product baddeleyite concentrate (5–13 kt/year) was recovered from the ore until 2001 [12]. In northern South Africa there is also the unique Pilanesberg zirconium rare-earth (eudialyte) deposit hosted by alkaline syenites [13]; however, its development is problematic because it lies within a national park.
The United States, which has supplied 6.5 Mt to the global market (10.8% of cumulative global production) and ranks third among zirconium raw material producers, has also long been the world’s largest consumer of zirconium products. Domestic production of zirconium raw materials in the United States began in 1922 at the Pablo Beach placer deposit in Florida2. By 1960, zircon concentrate production reached up to 56 kt (30% of global production). In the 1960–1980s production remained at 60–80 kt/year (10–15%), increased to 100–110 kt/year (8–9%) in the 1990–2010s, and in 2019–2024 declared production remained at 100–110 kt/year (7–8%) (see Figs. 2, 4 a, b). Coastal-marine placer deposits are exploited on both the eastern coast (Coos Bay) and the western coast (Aurelian Springs, Hickory, Lulaton, Mission, Amelia, Folkston, Boulogne, Green Cove Springs, Brink, Concord, Trail Ridge) (see Fig. 3) [7]. Zirconium products may also be obtained as by-products during the development of the large complex Bear Lodge carbonatite deposit in Wyoming, which is being considered as an alternative source of rare-earth raw materials outside China [14].
In the USSR, the zirconium raw material production base was established in the 1960s with the development of placer titanium-zirconium deposits in Ukraine (Stremigorodskoye, Irshanskoye, Malyshevskoye, Mezhdurechenskoye, and Volchanskoye) [15, 16].
The cumulative production of zirconium raw materials in the USSR and post-Soviet Ukraine amounts to 2.7 Mt, or 4.6% of global production. Production levels in the 1960s ranged from 8–16 kt/year, in the 1970s from 16–73 kt/year, and in the 1980s from 75–90 kt/year (9–10% of global production). After Ukraine’s independence, zirconium raw material production declined from 75 kt in 1992 to 25 kt in 1999, remaining at 20–30 kt/year in the 2000–2010s (1–3% of global production) and decreasing further to 8–10 kt/year in the 2020s (see Figs. 2, 4 a, b).

Fig. 4. Dynamics of zircon concentrate commodity flows by country in 1970–2022:
a, b – production (volumes and shares); c, d – exports (volumes and shares); e, f – imports (volumes and shares); g, h – net consumption (volumes and shares)
Sources: U.S. Geological Survey. URL: http://minerals.usgs.gov/minerals/pubs/commodity/tin/index.html#mcs;
British Geological Survey. Commodities & Statistics. URL: https://www.bgs.ac.uk/; United Nations Data. URL: https://data.un.org/
China accounts for 2.2% of cumulative global zirconium raw material production (1.3 Mt). Production began in 1969 with the development of coastal-marine placer deposits Bohaiwan, Lingshui, Wanning, Qionghai, and Wenchang (see Fig. 3). Production during the 1970–1990s was 10–15 kt/year. After increasing output from 15 kt in 1999 to 120 kt in 2004, Chinese zirconium mining has maintained zircon concentrate production at 100–140 kt/year (7–10% of global production) (see Figs. 2, 4 a, b). Zirconium is included in the list of critical materials for Chinese industry, and therefore projects are being considered for the development of ore deposits containing zirconium minerals: zircon in the carbonatite deposits Bozigor, Baerzhe, and Tudiling, as well as eudialyte in the alkaline syenites of the Saima deposit [6, 17].
In the 21st century, rising prices for zirconium raw materials led to the emergence of new suppliers on the global market: Vietnam (since 2003), Indonesia (since 2006), Mozambique (since 2007), Sierra Leone (since 2009), Kazakhstan (since 2011), Senegal (since 2014), and Kenya (since 2014).
Indonesia ranks fifth in cumulative global zirconium raw material production, with 2.7 Mt (4.4% of global production). Development of tin-rare-metal coastal-marine (Bangka and Belitung) and buried (Mandiri and Tisma) placer deposits began in 2006 [18] (see Fig. 3). In 2006–2015 the country produced 65–120 kt/year (5–8% of global production), but production later declined to 30–60 kt/year (2–3%) (see Figs. 2, 4 a, b). Zircon concentrate is also produced as a by-product during the exploitation of numerous placer tin deposits in Indonesia.
In Mozambique, coastal-marine placer deposits Corridor Sands, Pilivili, Namalope, and Sangage have been developed since 2007 (see Fig. 3). Cumulative production amounts to 1.1 Mt (1.2% of global production). In 2007–2013 concentrate production ranged from 25–45 kt/year, later increasing to 50–100 kt/year (3–5% of global production) (see Fig. 4, a). Projects are also being considered to develop rare-metal pegmatites containing zirconium and tantalum-niobium raw materials (Muiane, Naimpa, Nanro, Macula, Morrua, and Marropino) [19].
Coastal-marine titanium-zirconium deposits in Senegal have been developed since the 1930s, when the country was still a French colony. Production later ceased and resumed only in 2014 amid rising zirconium prices, at the Diogo and Kayar–Lompoul deposits (see Fig. 3) [20], reaching up to 64 kt/year (see Fig. 4, a). Cumulative production amounts to 613 kt (1.0% of global production).
In Vietnam, rising zirconium prices led to the start of zircon concentrate production in 2004 at offshore coastal-marine placer deposits Cam Hoa, Ky Ninh, Ke Sung, De Ji, Cat Khanh, and Ham Tan (see Fig. 3), with production volumes of 10–15 kt/year [21]. Cumulative production totals 416 kt (0.7% of global production).
Four placer titanium-zirconium deposits have been explored in Kenya: Kwale, Vipingo, Kilifi, and Mambrui (see Fig. 3). Mining began at the Kwale deposit in 2014 and continues to the present, with zircon concentrate production ranging from 26 to 90 kt/year [20]. Cumulative production amounts to 415 kt (0.7% of global production).
In Kazakhstan, development of the Obukhov titanium-zirconium deposit began in 2010 [22, 23], with production increasing to 78 kt in 2024 (see Figs. 2, 4 a). Cumulative production in Kazakhstan already amounts to 218 kt (0.4% of global production).
In Madagascar, the coastal-marine Toliara deposit has been developed since 2009, with annual production of up to 35 kt. Cumulative production in Madagascar amounts to 351 kt (0.6% of global production).
In Sierra Leone, zircon concentrate is produced as a by-product during the development of titanium (mainly rutile) coastal-marine placer deposits Bradford–Rotifunk, Gbangbama–Mogbwemo, and Sembekhan [24]. Although rutile placers have been mined since 1967, significant volumes of associated zirconium raw materials were marketed in 1991–1994 (up to 1.3 kt/year) and in 2009–2024 (3–11 kt/year) (see Fig. 4, a). Cumulative production amounts to 415 kt (0.7% of global production).
In India, coastal–marine placer mining began as early as the 1930–1940s, but a significant increase in zirconium raw material production at the Kerala, Chavara, Chhatrapur, and Srikurmam (see Fig. 3) deposits occurred in the 1970s [7, 25, 26]. Production volumes were 10–20 kt/year, increasing to 30–40 kt/year in 2007–2017, but declining again to about 20 kt/year by 2020 (see Fig. 2). Cumulative production in India amounts to 853 kt (1.4% of global production). Zirconium raw materials have been designated a critical resource for the nuclear industry in India [27].
In the 1930s Brazil was the global leader in zirconium raw material production. Initially mining was carried out from weathering crusts of eudialyte-bearing alkaline syenites at the Poços de Caldas deposit, with extraction of a colloform mixture of baddeleyite and zircon (brazilite)3. Later, coastal-marine titanium-zirconium deposits Guai, Cumuruxatiba, and Guaratiba were brought into production (see Fig. 3) [7, 28]. Production volumes in the 1950–1970s reached up to 5 kt/year, increasing to 20–25 kt/year in the 1980–2010s, but declining again to 6–11 kt/year in the 2020s (see Fig. 2). Cumulative production in Brazil amounts to 940 kt (1.6% of global production).
In Sri Lanka, as in India, zirconium raw materials were mined as early as the 1930–1940s, with a significant increase in production in the 1970s. Coastal-marine placer deposits Trincomalee, Pulmoddai, and Beruwala are currently exploited (see Fig. 3) [7, 29]. Production volumes were 1–5 kt/year, increasing to 10–25 kt/year in 1990–2010, but subsequently declining again to about 5 kt/year. Cumulative production amounts to 302 kt (0.5% of global production).
In Russia, zirconium raw materials are produced at the Kovdor Mining and Processing Plant during the beneficiation of apatite-magnetite ores from the Kovdor carbonatite deposit, with recovery of by-product baddeleyite concentrate (4–9 kt/year) [12, 30]. Zircon concentrate previously used in Russia was entirely imported (up to 15 kt/year), but following the launch in 2022 of the Tugan Mining and Processing Plant at the buried coastal-marine placer deposit of the same name, production is expected to reach up to 15 kt per year from 2025 [30, 31]. At the Yarega oil-sand deposit, which contains titanium–zirconium placers, extraction of these minerals is technologically difficult and economically inefficient [32]. In addition, several buried titanium-zirconium placer deposits have been prepared for development in Russia (Tsentralnoye [33], Lukoyanovskoye [34], Beshpagirskoye [35], and Tarskoye [36]), as well as complex zirconium-bearing ore deposits (Katuginskoye [37], Ulug-Tanzekskoye [38], Zashikhinskoye [39], and Sakharyok [40]) hosted by alkaline granites, and the Lovozero eudialyte deposit in alkaline syenites [41] (see Fig. 3). The Algama baddeleyite deposit is also known in the weathering crusts of the Algama carbonatite massif [42].
Small-scale zirconium raw material production also occurs in Malaysia (up to 2 kt/year), Nigeria (up to 2 kt/year), Turkey (up to 1 kt/year), and Thailand (up to 1 kt/year).
2 U.S. Geological Survey. URL: http://minerals.usgs.gov/minerals/pubs/commodity/tin/index.html#mcs
3 Ibid.
The currently available prepared (proven) reserves of zirconium raw materials worldwide (95 Mt) are sufficient for 20 years at the current level of global consumption, assuming annual growth of +3.5% (Fig. 5). Of this total, 55 Mt, or 58% of global reserves, are concentrated in Australia, the undisputed and longstanding world leader in zirconium raw material production, supported by the largest resource base of numerous coastal–marine placer deposits along the southern and southwestern coasts of the continent.
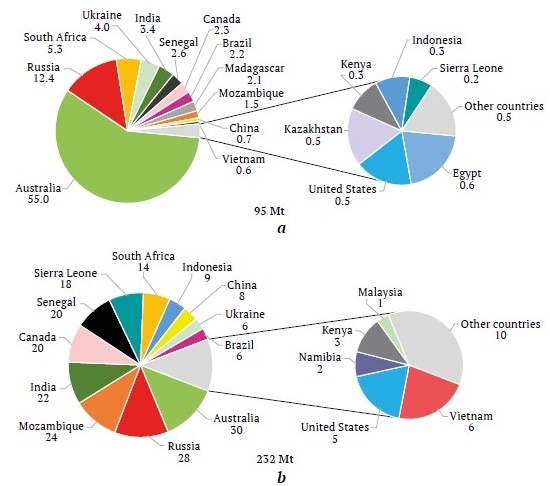
Fig. 5. Global proven reserves (a) and forecast resources (b) of zirconium as of 2024
Sources: U.S. Geological Survey. URL: http://minerals.usgs.gov/minerals/pubs/commodity/tin/index.html#mcs;
Mineral Information and Analytical Center. URL: https://www.mineral.ru/
Russia, with 12.4 Mt of zirconium raw materials recorded on its balance sheet, formally ranks second in the world. However, most of these reserves are associated with complex ore deposits in carbonatites, as well as in alkaline granites and syenites4, whose development is problematic. Only the Kovdor apatite-iron ore deposit hosted by carbonatites has been under development, where baddeleyite has been recovered in small quantities as a by-product. The reserves of technologically favorable titanium-zirconium placer deposits in Russia amount to 2.3 Mt.
South Africa, which ranks third in reserves and second in production, holds 5.3 Mt (13% of global reserves) in placer deposits along the country’s southern coast. Ukraine ranks fourth; although it is no longer among the top ten producers of zirconium raw materials, it still has a substantial prepared explored base of buried placer deposits amounting to 4 Mt (4.2% of global reserves). The decline in production is due to the fact that the Ukrainian deposits under development are buried placers, which increase operating costs, as well as to the complications arising under the current economic and political crisis.
India (fifth in reserves) and Senegal (sixth in reserves and eighth in production) also have fairly large prepared reserves of zirconium raw materials in coastal-marine placer deposits, amounting to 3.4 Mt and 2.6 Mt, respectively (3.6% and 2.7% of global reserves). However, whereas titanium-zirconium placer deposits in Senegal are being brought into production relatively actively, their development in India is constrained by the high cost of land acquisition in coastal zones.
In Canada, zirconium raw materials are not currently mined, but several explored complex ore deposits are known: Strange Lake [43] in carbonatites; Thor Lake [44], Nechalacho [45], and Kipawa Lake [46] in alkaline syenites; as well as technogenic accumulations in the tailings of oil sand processing at the Athabasca deposit that have been evaluated for zirconium raw materials [47] (see Fig. 3). These deposits contain 2.3 Mt of zirconium raw materials (2.4% of global reserves), placing Canada seventh in terms of reserves. These deposits periodically attract interest as potentially promising business projects, but their development is complicated by technological and economic challenges associated with complex mineral raw materials.
The top ten countries in terms of prepared (proven) reserves of zirconium raw materials also include Brazil with 2.2 Mt (2.3% of global reserves), Madagascar with 2.1 Mt (2.2%), and Mozambique with 1.5 Mt (1.6%).
Zirconium raw material reserves are being explored not only in the traditionally major producing countries, but also in other states. Many deposits have been explored but have not yet been brought into production: Cape Cross, Omaruru, and Swakopmund in Namibia [48]; the Rashid deposit in Egypt [49]; Tongo-Gandima in Cameroon [50]; Shakashu [51] and Karaotkel [52] in Kazakhstan; and Cox’s Bazar Beach in Bangladesh [53, 54]. The reasons for the delay in their commissioning include marginal project economics in some cases (Kazakhstan, Russia) and the high cost of acquiring coastal land occupied by settlements and agricultural land in others (the coasts of India, Sri Lanka, Bangladesh, Brazil, Turkey, and Germany).
There are notable differences between the ranking of countries by zirconium raw material resources (232 Mt) and by prepared reserves (see Fig. 5). While Australia remains the leader, with 30 Mt of zirconium raw material resources (mainly placer deposits), or 12.9% of global resources, Russia ranks second with 28 Mt (12.1%), predominantly in complex endogenic deposits. Mozambique ranks third (while fifth in the production ranking), with 24 Mt (10.3%): its coastline containing placer deposits remains only weakly developed, and extensive lateritic weathering crusts over alkaline granites are also considered prospective for zircon. Fourth and fifth places are occupied by countries with limited zirconium raw material production but substantial resources: coastal-marine deposits in India (22 Mt, or 9.5% of global resources) and complex ore deposits in Canada (20 Mt, or 8.6%). Senegal, which ranks eighth in zirconium raw material production, is sixth in resources, estimated at 20 Mt, or 8.6% of the global total. The top ten countries in terms of zirconium raw material resources also include Sierra Leone (18 Mt, 7.8%), South Africa (14 Mt, 6.0%), Indonesia (9 Mt, 3.9%), and China (8.0 Mt, 3.9%).
The resources of many countries remain underestimated because of limited geological knowledge in some cases and economic and political problems in others. New coastal-marine placer deposits of zirconium raw materials may be discovered along the marine coasts of Somalia, Libya, Madagascar, Liberia, Côte d’Ivoire, and Ghana in Africa; Indonesia and Papua New Guinea in Asia; and Uruguay, Guyana, Suriname, and French Guiana in South America (see Fig. 3).
Despite the traditional focus on technologically favorable placer deposits of zirconium raw materials, interest in ore deposits containing zirconium mineralization is increasing. As a rule, these are complex rare-metal deposits in carbonatites, alkaline granites, and syenites, as well as in weathering crusts developed over their ores and host rocks. The marketable zirconium products from such deposits are zircon, baddeleyite, and eudialyte.
Zircon concentrate is regarded as one of the saleable products of integrated development projects for zirconium-rare-earth deposits in carbonatites (Strange Lake [43] in Canada, Bear Lodge [14] in the United States, Baerzhe [55] in China, Khalzan-Buregtei [56] in Mongolia), as well as in alkaline granites (Katuginskoye [37], Ulug-Tanzekskoye [38], and Zashikhinskoye [39] in Russia) and in alkaline syenites (Thor Lake [44] in Canada, Bozigor [57] and Tudiling [58] in China).
Baddeleyite (natural zirconium oxide), previously mined at the carbonatite deposits of Poços de Caldas in Brazil and Palabora in South Africa, and currently produced at the Kovdor deposit in Russia, may become a target for future development at the Algama deposit [42] in Russia.
Eudialyte ores represent a complex zirconium-rare-earth raw material. Their deposits are known in alkaline syenite complexes: Nechalacho [45] in Canada, Tanbreez [59] and Kvanefjeld in Greenland, Norra Kärr in Sweden [60], the Lovozero eudialyte deposit [41] in Russia, Pilanesberg [13] in South Africa, Saima [62] in China, and Toongi (the Dubbo Project) [10] in Australia. The development of eudialyte ores is complicated by the production of several marketable products (zirconium and individual rare earths) that differ in value, are subject to price fluctuations and vary in market demand.
There is also some interest in zirconium deposits in weathering crusts, not only those developed over known primary zirconium occurrences (the carbonatites of Poços de Caldas in Brazil [61], and the rare-metal pegmatites Muiane, Naimpa, Nanro, Macula, Morrua, and Marropino in Mozambique [19]), but also those developed over rocks with disseminated zirconium mineralization, for example over ultrabasic-alkaline complexes in Brazil and the Philippines [63] and over alkaline syenites in Turkey [64]. Technogenic dumps from old placer tin workings in Indonesia [18] and Malaysia, as well as old gold workings in New Zealand [65], may also potentially be used for zirconium raw material production.
4 Ministry of Natural Resources and Environment of the Russian Federation. The State Report “On the State and Use of the Mineral Resources of the Russian Federation in 2023”. URL: https://rosnedra.gov.ru/activity/documents/gosudarstvennyydoklad-2023/
The marketable products of zirconium raw materials are zircon concentrate and baddeleyite concentrate.
The supply of baddeleyite (natural zirconium oxide) on the global market is limited due to the rarity of its deposits and amounts to only 4–9 kt/year [12, 30], supplied primarily from Russia. It is used as an abrasive raw material and for the production of refractories. The share of baddeleyite concentrate in the total global production of zirconium raw materials accounts for only 0.3–0.7%.
Global production of zircon concentrate increased from 537 kt in 1970 to 1.64 Mt in 2024 (+2.4% per year) (see Fig. 4, a). Significant volumes of zircon concentrate are produced by a limited group of producer countries. While traditional producers of zirconium raw materials (Australia, South Africa, and the United States) continue to dominate, the contribution of new producing countries has increased over time, including Mozambique, Senegal, Indonesia, China, as well as Madagascar, Kenya, Sierra Leone, and Vietnam. Production of zirconium raw materials has declined at the enterprises remaining in Ukraine, which inherited production capacity from the former USSR, decreasing from 65 kt in 1991 to 10 kt in the 2020s. At the same time, stable but relatively small-scale production of zirconium raw materials continues in Brazil, India, and Sri Lanka.
Although the production volumes of the traditional leaders (Australia, South Africa, the United States, the USSR / Ukraine, Brazil, India, Sri Lanka, and Malaysia) increased in supplies to the global market from 455 kt in 1970 to 1,130 kt in 2024, their share in the global supply of this raw material declined from 92% in 1999 to 69% in 2024. In contrast, the production of zirconium raw materials in new producing countries (China, Mozambique, Senegal, Indonesia, Vietnam, Kenya, Madagascar, Sierra Leone, and Kazakhstan) increased from 2.2 kt in 1999 (0.2% of global exports) to 500 kt in 2024 (30%). The combined share of all other countries amounts to 0.2–2.5% of global production (Fig. 6).

Fig. 6. Dynamics of the shares of zircon concentrate production in total global output, 1970–2024
Sources: U.S. Geological Survey. URL: http://minerals.usgs.gov/minerals/pubs/commodity/tin/index.html#mcs;
British Geological Survey. Commodities & Statistics. URL: https://www.bgs.ac.uk/; TrendEconomy. Open Data Portal. URL: https://trendeconomy.ru/
The dynamics of total global exports of zircon concentrate (see Fig. 4, c) broadly correspond to the dynamics of its total global production (see Fig. 4, a). This relationship is explained by the extremely high share of total global exports (including re-exports) relative to production (61–98%). The supply of zircon concentrate to the global market (exports) increased from 395 kt in 1970 to 1.86 Mt in 2024. The growth rate of global zircon concentrate exports (+2.8% per year) slightly exceeds the growth rate of its production (+2.4% per year), which indicates incomplete or non-transparent reporting of production volumes by some countries. There is also a clear trend toward an increasing share of global zircon concentrate exports relative to its production, rising from 60–80% in the 1970s to 85–98% in the 2010s–2020s (Fig. 7).
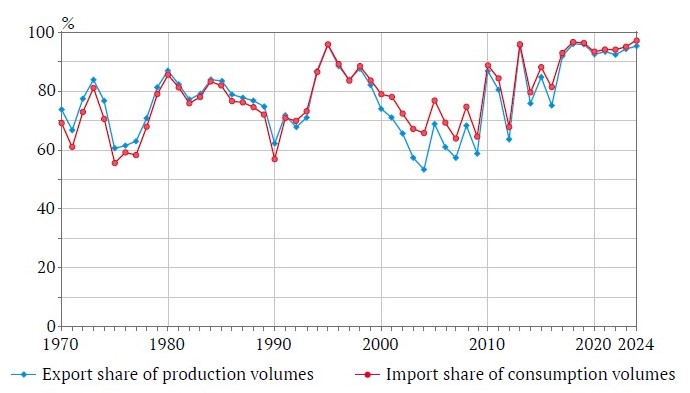
Fig. 7. Shares of global zircon concentrate exports and imports, 1970–2024
Sources: U.S. Geological Survey. URL: http://minerals.usgs.gov/minerals/pubs/commodity/tin/index.html#mcs;
British Geological Survey. Commodities & Statistics. URL: https://www.bgs.ac.uk/; United Nations Data. URL: https://data.un.org/;
TrendEconomy. Open Data Portal. URL: https://trendeconomy.ru/
Australia ranks first in exports of zircon concentrate as the undisputed global leader in its production. The country increased export volumes from 387 kt in 1970 to 950 kt in 2024 (adjusted to account for data on imports of Australian concentrate into China) (see Fig. 4, c), although its share in global zircon concentrate supply declined over this period from 98% to 50% (see Fig. 4, d). Australia exports 93–99% of the zircon concentrate it produces.
South Africa, which began large-scale production of zircon concentrate only in 1977, also exports 80–98% of its output. Its exports increased from 3 kt in 1977 to a peak of 465 kt in 2017, with a high export growth rate of +13.4% per year. In subsequent years, exports have remained relatively stable in the range of 340–400 kt/year. South Africa’s share in international trade reached a maximum of 51% in 2002, but later declined to local minima of 16% in 2022 and 20% in 2023–2024, primarily due to the emergence of new suppliers of zirconium raw materials (see Fig. 4, d).
Among the established exporting countries, the United States shows a highly variable export flow (6–119 kt/year, accounting for 2–13.6% of global exports), while Malaysia contributes a smaller export stream (4–40 kt/year, or 0.8–4.8%) (see Fig. 4, c).
New producing countries rapidly expanded their exports, shipping almost all of the zircon concentrate they produce (see Fig. 4, c, d): Mozambique – exports since 2007, reaching 101 kt in 2021, with a global export market share of up to 6.8%; Senegal – since 2014, up to 92 kt/year, share up to 6.2%; Madagascar – since 2009, up to 68 kt/year, up to 6.8%; Kenya – since 2015, up to 69 kt/year, up to 4.8%; Kazakhstan – since 2011, up to 78 kt/year, up to 4.2%; Vietnam – since 2000, up to 25 kt/year, up to 1.9%.
Since 1991, international trade in zirconium raw materials has experienced a sharp increase in transit trade (re-exports), reaching 15–20% of total import volumes. Among the re-exporting countries, several traditional transit trading hubs without domestic production should be noted, exporting 60–100% of their import volumes: the Netherlands (up to 40 kt/year), Belgium (up to 37 kt/year), and Hong Kong (up to 70 kt/year). In the United States, re-exports of zircon concentrate amounted to 7–26 kt/year in the 1970s–1980s, representing 10–25% of imports, but in the 1990s–2010s they increased to 40–120 kt/year, reaching up to 100% of import volumes. Malaysia, while producing up to 26 kt/year of zirconium raw materials and importing up to 65 kt/year, simultaneously exports up to 40 kt/year (50–80% of its import volumes). Transit re-exports of zirconium raw materials also occur in Italy and Thailand, though at smaller shares of imports.
For total global imports of zircon concentrate, the share of imports relative to consumption shows a smoother dynamic than the changes in the share of exports relative to production, possibly due to the influence of re-export accounting and unreported changes in stock levels (see Fig. 7). Global imports of zircon concentrate (including the double counting associated with transit trade) increased from 319 kt in 1970 to 2.19 Mt in 2024. The ranking of importing countries includes both countries without domestic production capacity (Japan and the European Union) and producer countries (the United States, China, and India) (see Fig. 4, e, f).
In the 1970s–1980s, the European Union was the global leader in zircon concentrate imports, purchasing 100–280 kt/year, or 38–52% of global imports. In the 1990s–2000s, import volumes increased to 370–470 kt/year, although the EU share did not grow and began to decline as China’s imports rose to 25% of global imports by 2010. Subsequently, volumes decreased due to declining domestic consumption, reaching 164 kt in 2024 (7.5% of global imports) (see Fig. 7, e, f).
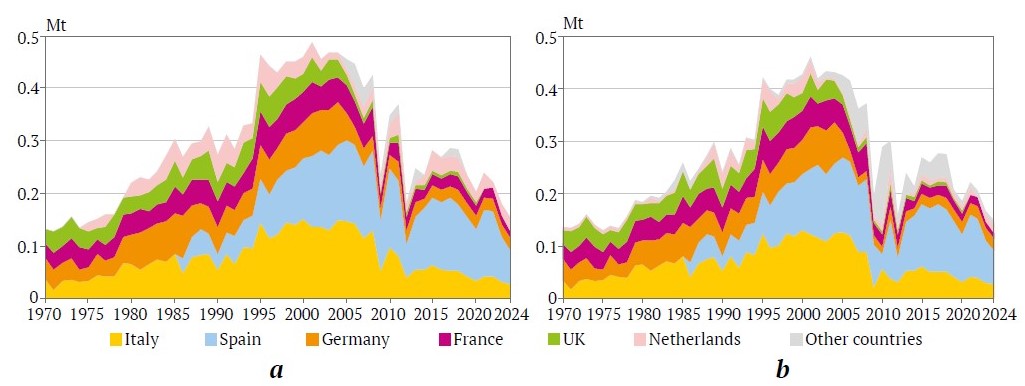
Fig. 8. Dynamics of zirconium raw material imports (a) and consumption (b) in the European Union countries, 1970–2024
Sources: United Nations Data. URL: https://data.un.org/; TrendEconomy. Open Data Portal. URL: https://trendeconomy.ru/
Within the European Union, imports are distributed among Italy, Spain, Germany, France, the United Kingdom, and the Netherlands (Fig. 8, a). Italy, which imported 30–45 kt/year in the 1970s (10–15% of global imports), increased purchases to 55–80 kt/year (10–14%) in the 1980s and to 115–150 kt/year (11–16%) during 1992–2008, reflecting the overall dynamics of global zirconium raw material consumption. However, imports into Italy later declined to 40–65 kt/year in the 2010s (2.6–6.7%) and to 28–44 kt/year in the 2020s (1.3–2.4% of global imports). In Spain (EU member since 1986), imports increased from 10–20 kt/year in the 1970s (3–5% of global imports) to 125–155 kt/year in the 2000s (7–15%), followed by a decline in the 2010s–2020s (65–140 kt/year, 3–7%). Germany experienced a period of relatively high zircon concentrate imports during 1970–2000 (40–85 kt/year, 6–14% of global imports) and lower import levels thereafter (25–40 kt/year, 1.1–2.7%). France maintained imports at 25–50 kt/year throughout the entire period studied (2–6% of global imports). In the United Kingdom, imports of zirconium raw materials remained at 25–50 kt/year (2–6% of global imports) until 2005, after which they declined to 3–7 kt/year (0.2–1.0%). In the Netherlands, imports range from 15–50 kt/year (1–6% of global imports), although a large share is re-exported through the country’s transit trade. A portion of imported zirconium raw materials is also re-exported from Germany and France (up to 20–25% of import volumes).
Japan, which imported 90–190 kt/year in the 1970s–1990s (25–35% of global imports), began reducing its imports after 1997 to 55–65 kt/year (5–9%) in the 2000s and to 20–40 kt/year (1.0–3.3%) in the 2010s–2020s.
A similar trend is observed in the dynamics of zirconium raw material imports into the United States, which imported 60–90 kt/year in the 1970s–1990s (10–25% of global imports), followed by a decline to 25–45 kt/year (1.5–3.5%) in the 2000s–2020s (see Fig. 4, e, f).
For China, reliable data on imports are not available prior to 1991. Subsequently, however, imports of zircon concentrate increased rapidly – from 99 kt in 1992 to 1.75 Mt in 2024 (from 14% to 80% of global imports), with an average growth rate of +8.9% per year (see Fig. 4, e, f).
A gradual increase in import volumes is also observed in India, from 3–10 kt/year in the 1990s (0.3–0.7%) to 30–75 kt/year in the 2010s (3–5%) (see Fig. 4, e, f).
Imports of zircon concentrate into Malaysia amounted to 0.5–3.0 kt/year in 1970–1980; subsequently they increased to 30–50 kt/year (see Fig. 4, e). However, most of these volumes are re-exported (25–40 kt/year), while domestic consumption remains relatively small (5–10 kt/year).
Whereas Brazil was a net exporter of zircon concentrate in the 1950s–1960s, domestic consumption later exceeded national production capacity, resulting in additional imports of 15–23 kt/year (see Fig. 4, e).
Changes in global zircon concentrate consumption are primarily driven by demand in the main application sectors: refractories in metallurgy and the glass industry, as well as ceramics in the construction sector. Consequently, there has been a pronounced increase in zircon concentrate consumption in China, associated with the rapid growth of its national economy – from 84 kt (8.7% of the global market) in 1997 to 1.83 Mt (78%) in 2024 (see Fig. 4, g, h), with an average growth rate of +11.9% per year. Most zirconium raw materials supplied to China are imported, accounting for up to 79% of consumption.
The United States, which was initially the world leader in zircon concentrate consumption (159 kt, or 31% of global consumption in 1971), reduced its use to 95–140 kt/year (13–19%) in the 1980s–1990s and to 75–110 kt/year (4–7%) in the 2000s–2020s (see Fig. 4, g, h). This trend was consistent with the post-industrial development policy of the United States in 1990–2010, which was accompanied by a reduction in industrial production and construction activity. Nevertheless, in the 2020s a process of reindustrialization has emerged in the United States, accompanied by increased consumption of mineral resources, including zirconium raw materials, reaching 100–135 kt/year. Due to the presence of domestic production, U.S. import dependence on zirconium raw materials remains relatively moderate at 18–50% of consumption.
The European Union, which led global consumption of zirconium raw materials in 1979–2005 (250–450 kt, or 25–40% of global consumption), has since maintained consumption at a somewhat lower level of 150–250 kt, representing 6–20% of global consumption due to China’s dominant role (see Fig. 4, g, h; Fig. 8, b). The leading EU consumers of zirconium raw materials are Spain and Italy (see Fig. 8, a). In these countries, the consumption of zircon concentrate has increased as a result of the development of ceramic production using opaque glazes, largely oriented toward export markets. In Spain (EU member since 1986), zirconium raw material consumption amounted to 20–35 kt/year in the 1970s–1980s (2–5% of the global market), increased to 50–95 kt/year in the 1990s (5–10%), and reached 90–130 kt/year in the 2010s–2020s (7–10%). Spain currently ranks fourth globally in zirconium raw material consumption. Consumption in Italy increased from 30–40 kt/year in the 1970s (7–9% of the global market) and 50–60 kt/year in the 1980s (also 7–9%) to 80–120 kt/year in the 1990s–2000s (9–12%). However, since 2007, a decline in ceramic production has resulted in a reduction in zirconium raw material consumption in Italy to 30–50 kt/year (2–3%) (see Fig. 8, b). In Germany, consumption dynamics have changed more gradually: 25–40 kt/year in the 1970s (5–9% of the global market), increasing slightly to 45–65 kt/year in the 1980s–1990s (5–9%), followed by a decline after 2006 to 12–25 kt/year (0.9–1.4%). In France, zircon concentrate consumption has remained relatively stable throughout the study period at 20–45 kt/year, corresponding to 1–5% of global consumption. In the United Kingdom, zirconium raw material consumption remained at 25–50 kt/year (2–6% of global imports) until 2005, after which it declined to 3–7 kt/year (0.2–1.0%). Zirconium raw materials consumed in EU countries are supplied almost entirely through imports.
Japan, which experienced rapid growth in the 1960s in the metal-intensive shipbuilding and automotive industries, requiring large volumes of ferrous and non-ferrous metals, was also among the top three global consumers of zircon concentrate (100% supplied by imports). In 1970–1992, consumption amounted to 120–200 kt/year (15–30% of global consumption). Subsequently, against the backdrop of slower economic growth, consumption declined to 50–75 kt/year (4–6%) in the 2000s and 20–40 kt/year (0.9–2.8%) in the 2010s–2020s (see Fig. 4, g, h).
During its existence, the USSR ranked third globally in zirconium raw material consumption in the 1970s–1980s, with 65–96 kt/year (10–15% of global consumption), all of which was produced domestically. Following industrial stagnation in the 1990s, Russia significantly reduced consumption of zirconium raw materials to 8–10 kt/year (see Fig. 4, g, h).
A smaller but steady increase in zircon concentrate consumption is also observed in India, rising from 10–15 kt/year in the 1970s–1990s (2–3% of the global market) to 35–75 kt/year in the 2000s (3–5%) and 60–120 kt/year in the 2010s–2020s (3–5%) (see Fig. 4, g, h). India currently ranks fourth globally in zirconium raw material consumption. However, whereas in the 1970s–1990s Indian industry relied primarily on domestic zirconium raw materials (imports accounting for only 0.5–1.1%), by the 2010s the share of imports had increased to 70–85%, making India critically import-dependent [27].
The currently available prepared (proven) reserves and forecast resources of zirconium raw materials worldwide (95 Mt + 252 Mt) are sufficient for several decades of global consumption at the current level, assuming an annual growth rate of +3.5%. The complexity of the zirconium mineral resource base lies in the fact that most reserves and resources are associated with endogenic deposit formations in carbonatites and alkaline rocks, whereas the entire historical development of zirconium raw materials has relied on coastal-marine and alluvial placer deposits, composed of loose sediments that are technologically efficient for beneficiation and the production of zircon concentrate. High prices for zirconium raw materials make projects for processing compositionally complex endogenic ores, which require preliminary crushing, economically viable. At the same time, these prices allow a reduction in the cut-off grades of placer deposits, enabling the exploitation of poorer sands and thereby expanding the resource base of this deposit type.
Placer deposits remain the primary source of zirconium raw materials, ensuring the leading positions of Australia and South Africa in global production. High demand for zirconium raw materials has also led to the emergence of new producers, developing placer deposits in Indonesia, Mozambique, Senegal, Kazakhstan, Madagascar, Kenya, Vietnam, and Sierra Leone. A significant increase in zirconium raw material production is possible in Mozambique, Madagascar, and Vietnam, as well as the emergence of new mining operations in Namibia, Tanzania, and Somalia.
The development of endogenic zirconium deposits is complicated by the production of multiple marketable products (zirconium, niobium, and rare-earth compounds), which have different and fluctuating prices and varying demand in commodity markets. Nevertheless, there are projects aimed at developing complex deposits with zircon concentrate as a by-product, including Strange Lake and Thor Lake (Canada), Bear Lodge (USA), Baerzhe, Bozigor, and Tudiling (China), Khalzan-Buregtei (Mongolia), and Katuginskoye, Ulug-Tanzekskoye, and Zashikhinskoye (Russia). Development is also possible for a new technological type of deposit – eudialyte ores, which represent complex niobium-zirconium-rare-earth raw materials. Development projects for such deposits include Nechalacho (Canada), Tanbreez and Kvanefjeld (Greenland), Toongi-Dubbo (Australia), Lovozerskoye (Russia), and Saima (China).
Unlike the relatively simple gravity beneficiation of sands from placer titanium-zirconium deposits, ores from endogenic complex deposits containing zircon mineralization require preliminary crushing and grinding. Beneficiation (gravity and flotation) uses complex flowsheets to produce individual mineral concentrates with commercial value, including zircon concentrate. For eudialyte deposits, beneficiation is also possible using gravity and flotation methods, while processing of eudialyte concentrate can be carried out using a nitric acid flowsheet, followed by sequential recovery of zirconium and rare earth elements from solution through chemical precipitation [66]. The development of endogenic deposits (both eudialyte and zircon-bearing), in addition to the extra costs associated with crushing and complex beneficiation and processing flowsheets, involves economic risks linked to the production of multiple marketable products with different and variable prices and varying demand in commodity markets [67].
In the global zirconium industry, a bipolar structure has formed between producing countries and consuming countries of zirconium raw materials. In international trade, the share of global zircon concentrate exports relative to production volumes is very high, with a clear increasing trend – from 60–80% in the 1970s to 85–98% in the 2010s. The growth rate of global zircon concentrate exports (+2.8% per year) slightly exceeds the growth rate of its production (+2.4% per year), which indicates incomplete reporting of production volumes in some countries (China, the United States, and Australia) and the presence of significant volumes of unrecorded re-exports.
The main suppliers of zircon concentrate to the global market remain the traditional producing countries Australia and South Africa. At the same time, new producing countries have emerged that mine zirconium raw materials in significant quantities, including China, Mozambique, Senegal, Indonesia, Vietnam, Kenya, Madagascar, Sierra Leone, and Kazakhstan. New participants may also appear in the market through the development of placer deposits in Namibia and Tanzania, as well as through projects involving endogenic complex deposits with by-product zirconium in Canada, Greenland, and Russia.
The development of the global zirconium raw materials market is highly complex due to rapid growth in consumption, rising prices, and the large share of international trade in this raw material, combined with conflicting interests between producing and consuming countries. In addition, a significant portion of global zirconium reserves is located in complex endogenic deposits, which are difficult to develop both technologically and economically [9, 30, 67, 68].
In most developed industrial countries, zirconium is classified as a critical mineral resource. In the dynamics of zirconium raw material consumption, the key factor is the rapid increase in demand in China, driven by the rapid growth of its national economy. China will remain the largest consumer of zirconium raw materials in the future, both through domestic production and – primarily – through imports.
The main risk factor for the global zirconium industry lies in the existence of a group of producing countries (Australia, South Africa, Mozambique, Indonesia and Senegal) and major consuming countries (China, the European Union, the United States, India, and Japan). The share of international trade in zirconium raw materials relative to production has already exceeded 90%, prompting consuming countries to classify this raw material as a critical commodity requiring supply regulation. In most cases, consuming countries have limited or no domestic production of zirconium raw materials. Even in China and the United States, the main consumers of zirconium raw materials, domestic production (for which information is not fully transparent) accounts for only 5–13% and 30–40% of consumption, respectively. The European Union, which is among the global leaders in zirconium raw material consumption, has virtually no domestic mining operations. A substantial volume of transit trade in zirconium raw materials has also emerged (15–20% of global imports), with the largest re-export volumes occurring in the Netherlands, Belgium, Hong Kong, and Malaysia.
Given the spatial separation of production and consumption centers, which has led to the majority of mined raw materials entering international trade, disruptions in the global zirconium raw materials and zirconium products market are inevitable during economic crises and political conflicts, inevitably affecting prices, trade volumes, and supply routes.
In response to growing global demand, the development of new mining operations continues to focus primarily on technologically efficient placer deposits, while projects involving endogenic complex deposits are slowed by risks associated with the production of multiple marketable products with differing prices and market demand.
1. Fedoseev S., Tcvetkov P., Sidorov N. Development potential of Russian zirconium industry on world markets. Journal of Business and Retail Management Research. 2017;12(1):41–48. URL: https://jbrmr.com/cdn/article_file/content_50624_17-10-04-21-28-12.pdf
2. Comstock B., Barberis P. (Eds.) Zirconium in the nuclear industry. In: 17th International Symposium. STP1543. West Conshohocken, PA: ASTM International; 2015. https://doi.org/10.1520/stp1543-eb
3. Ting S., Ruoyu L., Xiangning L. et al. The biocompatibility of dental graded nano-glass-zirconia material after aging. Nanoscale Research Letters. 2018;13(1):8. http://doi.org/10.1186/s11671-018-2479-4
4. Schulz K. J., DeYoung J. H. Jr., Seal R. R. II, Bradley D. C. Critical mineral resources of the United States – Economic and environmental geology and prospects for future supply. U.S. Geological Survey Professional Paper. 2017;1802:797. https://doi.org/10.3133/pp1802
5. Perks C., Mudd G. Soft rocks, hard rocks: the world’s resources and reserves of Ti and Zr and associated critical minerals. International Geology Review. 2022;64(7):987–1008. http://doi.org/10.1080/00206814.2021.1904294
6. Wang R. C, Che X. D, Wu B., Xie L. Critical mineral resources of Nb, Ta, Zr, and Hf in China. Chinese Science Bulletin. 2020;65(33):3763–3777. (In Chinese) https://doi.org/10.1360/TB-2020-0271
7. Hamilton N. T. M. Controls on the global distribution of coastal titanium-zirconium placers. International Geology Review. 1995;37(9):755–779. http://dx.doi.org/10.1080/00206819509465426
8. Perks C., Mudd G. Titanium, zirconium resources and production: A state of the art literature review. Ore Geology Reviews. 2019;107:629–646. https://doi.org/10.1016/j.oregeorev.2019.02.025
9. Mudd G. Assessing the availability of global metals and minerals for the sustainable century: From aluminium to zirconium. Sustainability. 2021;13:10855. https://doi.org/10.3390/su131910855
10. Spandler C., Morris C. Geology and genesis of the Toongi rare metal (Zr, Hf, Nb, Ta, Y and REE) deposit, NSW, Australia, and implications for rare metal mineralization in peralkaline igneous rocks. Contributions to Mineralogy and Petrology. 2016;171(121):104. https://doi.org/10.1007/s00410-016-1316-y
11. Xulu S., Phungula P. T., Mbatha N., Moyo I. Multi-year mapping of disturbance and reclamation patterns over tronox’s Hillendale mine, South Africa with DBEST and google earth engine. Land. 2021;10(7):760. http://doi.org/10.3390/land10070760
12. Bykhovsky L. Z., Remizova L. I., Chebotareva O. S. Zirconium resources of Russia: current state and prospects of the mineral resources base development. Mineral Recourses of Russia. Economics and Management. 2017;(2):11–18. (In Russ.)
13. Olivo G. R., Williams-Jones A. E. Hydrothermal REE-Rich eudialyte from the Pilanesberg Complex, South Africa. Canadian Mineralogist. 1999;37(3):653–663. https://rruff.info/doclib/cm/vol37/CM37_653.pdf
14. Andersen A. K., Larson P. B., Neill O. K., Clark J. G. Mineral chemistry and petrogenesis of a HFSE(+HREE) occurrence, peripheral to carbonatites of the Bear Lodge alkaline complex, Wyoming. American Mineralogist. 2016;101(7):1604–1623. http://doi.org/10.2138/am-2016-5532
15. Laverov N. P., Patyk-Kara N. G. (Eds.) Placer deposits of Russia and other CIS countries (Mineralogeny, industrial types, strategy of mineral resource base development). Moscow: Nauchny Mir; 1997. 479 p. (In Russ.)
16. Komliev O. O., Zhylkin S. V., Vasylenko S. P. et al. The role of neotectonic activations in the formation of the Ukrainian sub-province of titanium and titanium-zirconium placer deposits (scientific and applied aspects). In: XIV International Scientific Conference "Monitoring of Geological Processes and Ecological Condition of the Environment". Kyiv, 10–3 November 2020. Code 169495. European Association of Geoscientists & Engineers; 2020. http://doi.org/10.3997/2214-4609.202056071
17. Riesgo García M. V., Krzemień A., Manzanedo del Campo M. Á. et al. Rare earth elements mining investment: It is not all about China. Resources Policy. 2017;53:66–76. http://doi.org/10.1016/j.resourpol.2017.05.004
18. Van Gorsel J. T. Bibliography of the geology of Indonesia and surrounding areas. Edition 7.1. 2020:1–2826. URL: https://www.vangorselslist.com/pdf/BIG_2020_All_7.1.pdf
19. Dong J., Ren J., Sun H. et al. Mineral resources and investment environment in Mozambique. Geological Bulletin of China. 2022;41(1):184–195. (In Chinese) http://doi.org/10.12097/j.issn.1671-2552.2022.01.014
20. Gediga J., Morfino A., Finkbeiner M. et al. Life cycle assessment of zircon sand. International Journal Of Life Cycle Assessment. 2019;24(11):1976–1984 http://doi.org/10.1007/s11367-019-01619-5
21. Ngo Ch. T. Q., Kirichenko Yu. V. Mineral potential of subsea deposits in Vietnamese part of South China Sea. Russian Mining Industry. 2020;(1):140–143. (In Russ.)
22. Salikova N. S., Kutsenko N. Y., Zhakupova S. B., Urazbayeva S. E. Economic prospects for development of the titanium-zirconium deposit. Actual Scientific Research in the Modern World. 2021;(4–10):69–73. (In Russ.)
23. Sachkov V. I., Nefedov R. A., Amelichkin I. V. et al. Processing of zircon concentrate from the Obukhov Deposit. Bulletin of Tomsk State University. Chemistry. 2023;(29):83–92. (In Russ.)
24. Jalloh A. B., Sasaki K., Thomas M. O., Jalloh Y. The geology, mineral resources of Sierra Leone and how the resources can be used to develop the nation. Procedia Earth and Planetary Science. 2013;6:131–138. https://doi.org/10.1016/j.proeps.2013.01.018
25. Das S. K. Characteristics of zircon of Chhatrapur Beach Placer Deposit, Ganjam District, Odisha. Journal of the Geological Society of India. 2015;86(4):383-390. http://doi.org/10.1007/s12594-015-0326-0
26. Angusamy N., Sahayam J. D., Gandhi M. S., Rajamanickam G. V. Coastal placer deposits of Central Tamil Nadu, India. Marine Georesources and Geotechnology. 2005;23(3):137–174. http://doi.org/10.1080/10641190500192102
27. Kain V., Sinha D. K., Singh D., Asnani C.K. Atomic minerals: journey of India to self-sufficiency. Current Science. 2022;123(3):293–309. http://doi.org/10.18520/cs/v123/i3/293-309
28. Sabedot S., Wotruba H., Sampaio C. H. et al. Mineral processing of low quality zircon concentrates and preconcentrates. Transactions of the Institutions of Mining and Metallurgy, Section C: Mineral Processing and Extractive Metallurgy. 2009;118(2):114–121. http://doi.org/10.1179/174328509X408270
29. Mohanty S., Adikaram M., Sengupta D. et al. Geochemical, mineralogical and textural nature of beach placers, north-east Sri Lanka: Implications for provenance and potential resource. International Journal of Sediment Research. 2022;38(2):279–293. http://doi.org/10.1016/j.ijsrc.2022.09.004
30. Khatkov V. Yu., Boyarko G. Yu., Bolsunovskaya L. M. et al. Russian zirconium industry: current issues in raw material supply. Mining Science and Technology (Russia). 2023;8(2):128–140. https://doi.org/10.17073/2500-0632-2023-02-83
31. Kabanov A.A., Akhmadshin N.Yu. Tuganskoe deposit – the first-born of industrial development of titanium-zirconium placers in Russia. Gornyi Zhurnal. 2021;(10):54–64. (In Russ.)
32. Leontev L. I. Prospects for the development of the titanium potential of the Yareg deposit. Prospect and Protection of Mineral Resources. 2021;(8):56–60. (In Russ.)
33. Patyk-Kara N. G., Bochneva A. A., Chizhova I. A. et al. Mineral assemblages of titanium-zirconium sands at the central deposit, the East European platform. Geology of Ore Deposits. 2018;50:218–239. http://doi.org/10.1134/S1075701508030045 (Orig. ver.: Patyk-Kara N. G., Bochneva A. A., Chizhova I. A. et al. Mineral assemblages of titanium-zirconium sands at the central deposit, the East European platform. Gеologiya Rudnyh Mеstorozhdеnij. 2008;50(3):246–270. (In Russ.))
34. Drachev V. G. Technical and economical substantiation of the technology for development of alluvial titanium-zirconium deposit. Gornyi Zhurnal. 2006;(8):15–19. (In Russ.)
35. Bykhovsky L. Z., Vasilyev A. T., Zabirko A. G. On the development project for the Beshpagirskoye complex rare metal-titanium placer deposit. Mineral Resources of Russia. Economics and Management. 2010;(2):68–75. (In Russ.)
36. Grishkin N. N. The Tarskoye deposit ilmenite-rutile-zircon sands dressability study with production of titanium-containing concentrates. Obogashchenie Rud. 2005;(4):47–48. (In Russ.)
37. Gongalsky B., Krivolutskaya N. The Nb-Ta-Zr-REE-Y Katugin deposit. Modern Approaches in Solid Earth Sciences. 2019:257–271. http://doi.org/10.1007/978-3-030-03559-4_10
38. Khertek A. K. O. Rare earth metals of Tuva and their deposits. Natural Resources, Environment and Society. 2020;(4):24–29. https://doi.org/10.24411/2658-4441-2020-10033
39. Alymova N. V., Vladykin N. V. Ore-Content of rare-metal granites of Zashikhinsky Massif (Irkutsk Region) and minerals concentrating Ta, Nb, Th, Zr, TR. The Bulletin of Irkutsk State University. Series Earth Sciences. 2018;25:15–29. (In Russ.) http://doi.org/10.26516/2073-3402.2018.25.15
40. Zozulya D. R., Lyalina L. M., Eby N., Savchenko Ye. E. Ore geochemistry, zircon mineralogy, and genesis of the Sakharjok Y-Zr deposit, Kola Peninsula, Russia. Geology of Ore Deposits. 2012;54(2):81–98. https://doi.org/10.1134/S1075701512020079 (Orig. ver.: Zozulya D. R., Lyalina L. M., Eby N., Savchenko Ye. E. Ore geochemistry, zircon mineralogy, and genesis of the Sakharjok Y-Zr deposit, Kola Peninsula, Russia. Geologiya Rudnykh Mestorozhdenii, 2012;54(2):99–118. (In Russ.))
41. Kogarko L. N. Features of eudialyte ore formation in high-alkaline magmas of the Lovozero deposit (Kola peninsula). Doklady Earth Sciences. 2021;496(2):112–114. https://doi.org/10.1134/S1028334X21020082 (Orig. ver.: Kogarko L. N. Features of eudialyte ore formation in high-alkaline magmas of the Lovozero deposit (Kola peninsula). Doklady Rossijskoj Akademii Nauk. Nauki o Zemle. 2021;496(2):128–131. (In Russ.) http://doi.org/10.31857/S2686739721020080)
42. Bagdasarov Yu. A., Pototskiy Yu. P., Zinkova O. N. Baddeleyite-containing stratiform bodies in old carbonate sequences. A possible new genetic type of zirconium deposits. Reports of the USSR Academy of Sciences. Earth science sections. 1990;315(6):144–148.
43. Gysi A. P., Williams-Jones Anthony E., Collins P. Lithogeochemical vectors for hydrothermal processes in the Strange Lake peralkaline granitic REE-Zr-Nb deposit. Economic Geology. 2016;111(5):1241–1276. http://doi.org/10.2113/econgeo.111.5.1241
44. Sheard E. R., Williams-Jones A. E., Heiligmann M. et al. Controls on the concentration of zirconium, niobium, and the rare earth elements in the Thor Lake rare metal deposit, Northwest Territories, Canada. Economic Geology. 2012;107(1):81–104. http://doi.org/10.2113/econgeo.107.1.81
45. Möller V., Williams-Jones A. E. Magmatic and hydrothermal controls on the mineralogy of the basal zone, Nechalacho REE-Nb-Zr deposit, Canada. Economic Geology. 2017;112(8):1823–1856. http://doi.org/10.5382/econgeo.2017.4531
46. Constantin M., Matte S. Mineralogical and geochemical characterisation of the Kipawa syenite complex, Quebec: implications for rare-earth element deposits. Scientific Presentation 129. Geological Survey of Canada; 2022. 36 p. http://doi.org/10.4095/329212
47. Marshall G. M., Patarachao B., Moran K. E., Mercier P. H. J. Zircon mineral solids concentrated from Athabasca oil sands froth treatment tailings: Surface chemistry and flotation properties. Minerals Engineering. 2014;65:79–87. http://doi.org/10.1016/j.mineng.2014.05.016
48. Lohmeier S., Lottermoser B. G., Strauß K. et al. Nearshore marine garnet and magnetite placers in the Erongo and S-Kunene regions, Namibia. Journal of African Earth Sciences. 2021;180:104221. http://doi.org/10.1016/j.jafrearsci.2021.104221
49. Abouzeid A.-Z. M., Khalid A.-A. M. Mineral industry in Egypt-Part I: metallic mineral commodities. Natural Resources. 2011;2(1):35–53. http://doi.org/10.4236/nr.2011.21006
50. Ndjigui P.-D., Bassanak Ongboye P. R., Ndong Bidzang F. TiO2–Zr–Th–Y–rare-earth elements ore deposit in unconsolidated fine-grained sediments from Tongo Gandima in the Bétaré Oya Gold district, Eastern Cameroon. Geological Journal. 2021;56(5):2676–2698. http://doi.org/10.1002/gj.4061
51. Bulatov K.V., Gazaleeva G.I., Shikhov N.V., Nazarenko L.N. Development of a beneficiation scheme for titanium-zirconium sands of the Shokash deposit, North Kazakhstan. Obogashchenie Rud. 2023;(6):3–8. (In Russ.) http://doi.org/10.17580/or.2023.06.01
52. Sapargaliev E. M., Azelkhanov A. Zh., Kravchenko M. M. et al. Prospects for the practical value of the integrated development of poor titanium-zirconium placers and weathering crusts in Kazakhstan. Perm Journal of Petroleum and Mining Engineering. 2021;21(1):17–22. (In Russ.) http://doi.org/10.15593/2712-8008/2021.1.3
53. Mohanty S., Adikaram M., Sengupta D., et al. Geochemical, mineralogical and textural nature of beach placers, north-east Sri Lanka: Implications for provenance and potential resource. International Journal of Sediment Research. 2022;38(2):279–293. http://doi.org/10.1016/j.ijsrc.2022.09.004
54. Hasan A. S. M. M., Hossain I., Rahman Md. A. et al. Chemistry and mineralogy of Zr- and Ti-rich minerals sourced from Cox's Bazar Beach placer deposits, Bangladesh: Implication of resources processing and evaluation. Ore Geology Reviews. 2022;141:104687. http://doi.org/10.1016/j.oregeorev.2021.104687
55. Qiu K., Yu H., Wu M. et al. Discrete Zr and REE mineralization of the Baerzhe rare-metal deposit, China. American Mineralogist. 2019;104(10):1487–1502. http://doi.org/10.2138/am-2019-6890
56. Kovalenko V. I. The peralkaline granite-related Khaldzan-Buregtey rare metal (Zr, Nb, REE) deposit, Western Mongolia. Economic Geology. 1995;90(3):530–547. http://doi.org/10.2113/gsecongeo.90.3.530
57. Sun Z., Qin K., Mao Y. et al. Mineral chemistry of pyrochlore supergroup minerals from the Boziguoer Nb-Ta-Zr-Rb-REE deposit, NW China: Implications for Nb Enrichment by Alkaline Magma Differentiation. Minerals. 2022;12(7):785. http://doi.org/10.3390/min12070785
58. Yan S., Shan Q., Niu H.-C., et al. Timing and genesis of the Tudiling trachyte Nb-Ta-Zr-REE deposit in the South Qinling (Central China): Implications for rare metal enrichment in extrusive peralkaline magmatic systems. Ore Geology Reviews. 2021;139(Part B):104535. http://doi.org/10.1016/j.oregeorev.2021.104535
59. Schønwandt H. K., Barnes G. B., Ulrich T. Chapter 5 – A description of the world-class rare earth element deposit, Tanbreez, South Greenland. In: de Lima I. B., Leal Filho W. (Eds.) Rare Earths Industry: Technological, Economic, and Environmental Implications. Amsterdam: Elsevier; 2015. Pp. 73–85. http://doi.org/10.1016/B978-0-12-802328-0.00005-X
60. Sjöqvist A., Cornell D. H., Andersen T. et al. Three compositional varieties of rare-earth element ore: eudialyte-group minerals from the Norra Kärr alkaline complex, Southern Sweden. Minerals. 2013;3(1):94–120. http://doi.org/10.3390/min3010094
61. Tolbert G. E. The uraniferous zirconium deposits of the Pocos de Caldas Plateau, Brazil. U.S. Geological Survey Bulletin 1185-C. 1966. 28 p. https://doi.org/10.3133/b1185C
62. Wu B., Wang R.-C., Yang J.-H. et al. Zr and REE mineralization in sodic lujavrite from the Saima alkaline complex, northeastern China: A mineralogical study and comparison with potassic rocks. Lithos. 2016;262:232–246. http://doi.org/10.1016/j.lithos.2016.07.013
63. Marker A., Friedrich G., Carvalho A., Melfi A. Control of the distribution of Mn, Co, Zn, Zr, Ti and REEs during the evolution of lateritic covers above ultramafic complexes. Journal of Geochemical Exploration. 1991;40(1–3):361–383. http://doi.org/10.1016/0375-6742(91)90048-Y
64. Pulat O., Karakaş M., Yasti M. A. Relationship of ore properties and alteration of the Büyük Kuluncak (Malatya) Nb–U–NTE–Zr–Li deposit. Bulletin of the Mineral Research and Exploration. 2022;167(167):127–148. http://doi.org/10.19111/bulletinofmre.973626
65. Wells H. C., Haverkamp R. G. Characterization of the heavy mineral suite in a holocene beach placer, Barrytown, New Zealand. Minerals. 2020;10(2):86. http://doi.org/10.3390/min10020086
66. Chanturiya V. A., Minenko V. G., Ryzanceva M. V., Samusev A. L. Complex Processing of eudialyte concentrate. Tsvetnye Metally. 2024;(12):47–56. (In Russ.) https://doi.org/10.17580/tsm.2024.12.05
67. Boyarko G. Yu. Basic and associated commercial components of complex mineral raw materials: technological and economic problems of their extraction and selling. Mineral Recourses of Russia. Economics and Management. 2024;(5):74–80. (In Russ.)
68. Luo F., Liu W., Xu M. et al. Evolution characteristics and invulnerability simulation analysis of global zirconium ore trade. Frontiers in Earth Science. 2025;12:1496579. http://doi.org/10.3389/feart.2024.1496579
69.
Grigory Yu. Boyarko – Dr. Sci. (Econ.), Cand. Sci. (Geol. and Min.), Professor of the Oil and Gas Engineering Department
Tomsk
Scopus ID 56350674500
Liudmila M. Bolsunovskaya – Cand. Sci. (Philolog.), Associate Professor of the Foreign Languages Department, School of Social Sciences
Tomsk
Scopus ID 56350747600
SPIN 2542-1748
Boyarko G.Yu., Bolsunovskaya L.M. Global zirconium market as a critical mineral raw material. Mining Science and Technology (Russia). 2026;11(1):16-34. https://doi.org/10.17073/2500-0632-2025-08-1020




Editor-in-Chief
Petrov V.L. Email this article (Login required)
Email the author (Login required)
Email this article (Login required)
Email the author (Login required) 119049, Moscow, Leninsky Prospect, 4, b. 1
The National University of Science and Technology MISIS (NUST MISIS)
Tel.: +7 (968) 848-61-24
E-mail: send@misis.ru





